Page Summary
-
This dataset, which provides daily nighttime land surface temperature and emissivity, has been superseded by NASA/VIIRS/002/VNP21A1N.
-
The dataset covers the period from January 19, 2012, to May 1, 2024, with a daily cadence.
-
It contains bands for Land Surface Temperature, Quality Control, and Emissivity at a 1km pixel size.
-
The data is freely accessible with a request to cite the dataset when used in publications.
- Dataset Availability
- 2012-01-19T00:00:00Z–2024-05-01T00:00:00Z
- Dataset Producer
- NASA LP DAAC at the USGS EROS Center
- Cadence
- 1 Day
- Tags
Description
The NASA Suomi National Polar-Orbiting Partnership (Suomi NPP) Visible Infrared Imaging Radiometer Suite (VIIRS) Land Surface Temperature and Emissivity (LST&E) Night Version 1 product (VNP21A1N) is compiled daily from nighttime Level 2 Gridded (L2G) intermediate products.
The L2G process maps the daily VNP21 swath granules onto a sinusoidal MODIS grid and stores all observations overlapping a gridded cell for a given night. The VNP21A1 algorithm sorts through all these observations for each cell and estimates the final LST value as an average from all cloud-free observations that have good LST accuracies. Only observations having observation coverage more than a certain threshold (15%) are considered for this averaging.
Documentation:
Bands
Bands
Pixel size: 1000 meters (all bands)
| Name | Units | Pixel Size | Description | ||||||||||||||||||||||||||||||||||||||||||||||||||||||||||||||||||||||||||||||||||||||||||||||||
|---|---|---|---|---|---|---|---|---|---|---|---|---|---|---|---|---|---|---|---|---|---|---|---|---|---|---|---|---|---|---|---|---|---|---|---|---|---|---|---|---|---|---|---|---|---|---|---|---|---|---|---|---|---|---|---|---|---|---|---|---|---|---|---|---|---|---|---|---|---|---|---|---|---|---|---|---|---|---|---|---|---|---|---|---|---|---|---|---|---|---|---|---|---|---|---|---|---|---|---|
LST_1KM |
K | 1000 meters | Daily 1 km Land Surface Temperature. |
||||||||||||||||||||||||||||||||||||||||||||||||||||||||||||||||||||||||||||||||||||||||||||||||
QC |
1000 meters | Daily Quality control for LST and emissivity |
|||||||||||||||||||||||||||||||||||||||||||||||||||||||||||||||||||||||||||||||||||||||||||||||||
Emis_14 |
1000 meters | Daily M14 emissivity |
|||||||||||||||||||||||||||||||||||||||||||||||||||||||||||||||||||||||||||||||||||||||||||||||||
Emis_15 |
1000 meters | Daily M15 emissivity |
|||||||||||||||||||||||||||||||||||||||||||||||||||||||||||||||||||||||||||||||||||||||||||||||||
Emis_16 |
1000 meters | Daily M16 emissivity |
|||||||||||||||||||||||||||||||||||||||||||||||||||||||||||||||||||||||||||||||||||||||||||||||||
View_Angle |
deg | 1000 meters | View zenith angle of LST |
||||||||||||||||||||||||||||||||||||||||||||||||||||||||||||||||||||||||||||||||||||||||||||||||
View_Time |
h | 1000 meters | Time of LST observation |
||||||||||||||||||||||||||||||||||||||||||||||||||||||||||||||||||||||||||||||||||||||||||||||||
Terms of Use
Terms of Use
LP DAAC NASA data are freely accessible; however, when an author publishes these data or works based on the data, it is requested that the author cite the datasets within the text of the publication and include a reference to them in the reference list.
Citations
Please visit LP DAAC 'Citing Our Data' page for information on citing LP DAAC datasets.
DOIs
Explore with Earth Engine
Code Editor (JavaScript)
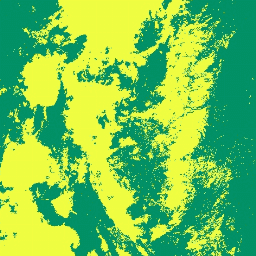
var dataset = ee.ImageCollection('NOAA/VIIRS/001/VNP21A1N')
                  .filter(ee.Filter.date('2022-11-01', '2022-12-01'));

var visualization = {
  bands: ['LST_1KM'],
  min: 200,
  max: 300,
  palette: [
    'a50026',
    'd73027',
    'f46d43',
    'fdae61',
    'fee08b',
    'ffffbf',
    'd9ef8b',
    'a6d96a',
    '66bd63',
    '1a9850',
    '006837',
  ]
};
Map.setCenter(41.2, 38.84, 3);
Map.addLayer(dataset, visualization, 'LST');