Page Summary
-
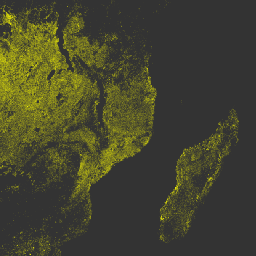
The NASA VIIRS Thermal Anomalies/Fire (VNP14A1) dataset provides daily information on active fires and thermal anomalies globally at 1km resolution.
-
The dataset is available from 2012-01-19 to 2025-10-15 with a daily update cadence.
-
Bands in the dataset include FireMask for confidence, MaxFRP for fire radiative power, QA for quality control, and sample number.
-
Data is freely accessible from NASA LP DAAC, with a request to cite when used in publications.
-
The dataset can be explored and analyzed using the Google Earth Engine platform.
- Dataset Availability
- 2012-01-19T00:00:00Z–2026-07-10T00:00:00Z
- Dataset Producer
- NASA LP DAAC at the USGS EROS Center
- Cadence
- 1 Day
- Tags
Description
The daily Suomi National Polar-Orbiting Partnership NASA Visible Infrared Imaging Radiometer Suite (VIIRS) Thermal Anomalies/Fire (VNP14A1) Version 1 data product provides daily information about active fires and other thermal anomalies. The VNP14A1 data product is a global, 1km gridded composite of fire pixels detected from VIIRS 750m bands over a daily (24-hour) period. The VNP14 data products are designed after the Moderate Resolution Imaging Spectroradiometer (MODIS) Thermal Anomalies/Fire product suite.
Documentation:
Bands
Bands
Pixel size: 1000 meters (all bands)
| Name | Units | Pixel Size | Description | ||||||||||||||||||||||||||||||||||||||||||||||||||||||||||||||||||||||||||||||||||||||||||||||||
|---|---|---|---|---|---|---|---|---|---|---|---|---|---|---|---|---|---|---|---|---|---|---|---|---|---|---|---|---|---|---|---|---|---|---|---|---|---|---|---|---|---|---|---|---|---|---|---|---|---|---|---|---|---|---|---|---|---|---|---|---|---|---|---|---|---|---|---|---|---|---|---|---|---|---|---|---|---|---|---|---|---|---|---|---|---|---|---|---|---|---|---|---|---|---|---|---|---|---|---|
FireMask |
1000 meters | Confidence of fire. |
|||||||||||||||||||||||||||||||||||||||||||||||||||||||||||||||||||||||||||||||||||||||||||||||||
MaxFRP |
MW | 1000 meters | Maximum Fire Radiative Power |
||||||||||||||||||||||||||||||||||||||||||||||||||||||||||||||||||||||||||||||||||||||||||||||||
QA |
1000 meters | Global Land Surface Phenology Quality Control |
|||||||||||||||||||||||||||||||||||||||||||||||||||||||||||||||||||||||||||||||||||||||||||||||||
sample |
1000 meters | Sample number within a swath |
|||||||||||||||||||||||||||||||||||||||||||||||||||||||||||||||||||||||||||||||||||||||||||||||||
FireMask Class Table
| Value | Color | Description |
|---|---|---|
| 0 | None | Not processed (no data or poor quality data) |
| 1 | None | Not processed (bowtie deletion) |
| 2 | None | Unused |
| 3 | None | Water |
| 4 | None | Cloud |
| 5 | None | Land |
| 6 | None | Unclassified |
| 7 | None | Low confidence fire pixel |
| 8 | None | Nominal confidence fire pixel |
| 9 | None | High confidence fire pixel |
Terms of Use
Terms of Use
LP DAAC NASA data are freely accessible; however, when an author publishes these data or works based on the data, it is requested that the author cite the datasets within the text of the publication and include a reference to them in the reference list.
Citations
Please visit LP DAAC 'Citing Our Data' page for information on citing LP DAAC datasets.
DOIs
Explore with Earth Engine
Code Editor (JavaScript)
var dataset = ee.ImageCollection('NASA/VIIRS/002/VNP14A1')
                  .filter(ee.Filter.date('2017-05-01', '2017-12-30'));
var visualization = {
  bands:['MaxFRP'],
  min: 0.0,
  max: 1.0,
  palette: ['#00FF00', '#00FFFF', '#00FF00', '#FFFFE0', '#FFFFA0', '#FFFF00'],
};
var lon = 38.06;
var lat = -14.22;
Map.setCenter(lon, lat, 6);
Map.addLayer(dataset, visualization, 'MaxFRP');