MOD11A2.006 Terra Land Surface Temperature and Emissivity 8-Day Global 1km [deprecated]
Stay organized with collections
Save and categorize content based on your preferences.
Page Summary
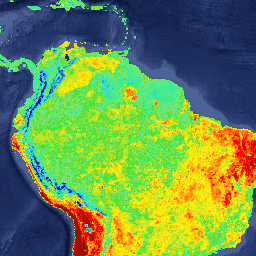
This dataset, MODIS/006/MOD11A2, provides an average 8-day land surface temperature (LST) in a 1200 x 1200 kilometer grid from 2000-02-18 to 2022-11-09.
Each pixel value is a simple average of corresponding MOD11A1 LST pixels collected over an 8-day period, chosen to match the Terra and Aqua platforms' ground track repeat period.
The dataset includes day and night-time surface temperature bands, quality indicator layers, MODIS bands 31 and 32, and eight observation layers.
MODIS data and products from the LP DAAC have no restrictions on subsequent use, sale, or redistribution.
This dataset has been superseded by MODIS/061/MOD11A2.
The MOD11A2 V6 product provides an average 8-day land
surface temperature (LST) in a 1200 x 1200 kilometer grid. Each
pixel value in MOD11A2 is a simple average of all the corresponding
MOD11A1 LST pixels collected within that 8 day period. The 8 day
compositing period was chosen because twice that period is the
exact ground track repeat period of the Terra and Aqua platforms.
In this product, along with both the day- and night-time surface
temperature bands and their quality indicator (QC) layers, are
also MODIS bands 31 and 32 and eight observation layers.
The MOD11A2 V6 product provides an average 8-day land surface temperature (LST) in a 1200 x 1200 kilometer grid. Each pixel value in MOD11A2 is a simple average of all the corresponding MOD11A1 LST pixels collected within that 8 day period. The 8 day compositing period was chosen because twice …
[[["Easy to understand","easyToUnderstand","thumb-up"],["Solved my problem","solvedMyProblem","thumb-up"],["Other","otherUp","thumb-up"]],[["Missing the information I need","missingTheInformationINeed","thumb-down"],["Too complicated / too many steps","tooComplicatedTooManySteps","thumb-down"],["Out of date","outOfDate","thumb-down"],["Samples / code issue","samplesCodeIssue","thumb-down"],["Other","otherDown","thumb-down"]],[],[],["This dataset offers an 8-day average land surface temperature (LST) product, MOD11A2 V6, within a 1200 x 1200 km grid, derived from MOD11A1 LST pixel averages. Data, with an 8-day cadence, spans from 2000-02-18 to 2022-11-09, and is accessible via Google Earth Engine. The dataset includes day/night surface temperature bands, quality indicators, MODIS bands 31 and 32, and observation layers, all at a 1000-meter pixel size.\n"]]