MOD11A1.006 Terra Land Surface Temperature and Emissivity Daily Global 1km [deprecated]
Mit Sammlungen den Überblick behalten
Sie können Inhalte basierend auf Ihren Einstellungen speichern und kategorisieren.
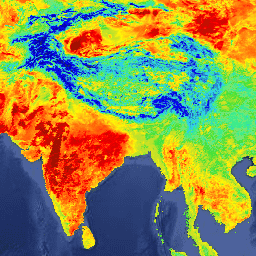
Das Produkt „MOD11A1 V6“ bietet tägliche Werte für die Landoberflächentemperatur (Land Surface Temperature, LST) und den Emissionsgrad in einem Raster von 1.200 × 1.200 Kilometern. Der Temperaturwert wird aus dem MOD11_L2-Swath-Produkt abgeleitet. Oberhalb von 30 Grad Breitengrad können für einige Pixel mehrere Beobachtungen vorliegen, bei denen die Kriterien für wolkenlosen Himmel erfüllt sind. In diesem Fall ist der Pixelwert der Durchschnitt aller infrage kommenden Beobachtungen. Zusammen mit den Bändern für die Oberflächentemperatur bei Tag und Nacht und den zugehörigen Qualitätsindikator-Layern werden die MODIS-Bänder 31 und 32 sowie sechs Beobachtungs-Layer bereitgestellt.
0: LST wurde produziert, gute Qualität, keine detailliertere QA erforderlich
1: LST wurde erstellt, andere Qualität, detailliertere Qualitätssicherung wird empfohlen
2. LST wurde aufgrund von Wolkeneffekten nicht erstellt
3. LST wurde aus anderen Gründen als Wolken nicht produziert
Bits 2–3: Flag für Datenqualität
0: Gute Datenqualität
1: Andere Qualitätsdaten
2: Noch nicht festgelegt
3: TBD
Bits 4–5: Flag für Emissivitätsfehler
0: Durchschnittlicher Emissivitätsfehler <= 0,01
1.Durchschnittlicher Emissivitätsfehler <= 0,02
2.Durchschnittlicher Emissivitätsfehler <= 0,04
3: Durchschnittlicher Emissivitätsfehler > 0,04
Bits 6–7: LST-Fehlerflag
0: Durchschnittlicher LST-Fehler <= 1 K
1: Durchschnittlicher LST-Fehler <= 2 K
2: Durchschnittlicher LST-Fehler <= 3 K
3: Durchschnittlicher LST-Fehler > 3 K
Day_view_time
Std.
0
240
0,1
1.000 Meter
Ortszeit der Beobachtung
Day_view_angle
Grad
0
130
-65
1.000 Meter
Zenitwinkel der Tagesbeobachtung
LST_Night_1km
K
7.500
65535
0,02
1.000 Meter
Bodentemperatur bei Nacht
QC_Night
1.000 Meter
Qualitätsindikatoren für die nächtliche LST
Bitmaske für QC_Night
Bits 0–1: Obligatorische QA-Flags
0: LST wurde produziert, gute Qualität, keine detailliertere QA erforderlich
1: LST wurde erstellt, andere Qualität, detailliertere Qualitätssicherung wird empfohlen
2. LST wurde aufgrund von Wolkeneffekten nicht erstellt
3. LST wurde aus anderen Gründen als Wolken nicht produziert
Bits 2–3: Flag für Datenqualität
0: Gute Datenqualität
1: Andere Qualitätsdaten
2: Noch nicht festgelegt
3: TBD
Bits 4–5: Flag für Emissivitätsfehler
0: Durchschnittlicher Emissivitätsfehler <= 0,01
1.Durchschnittlicher Emissivitätsfehler <= 0,02
2.Durchschnittlicher Emissivitätsfehler <= 0,04
3: Durchschnittlicher Emissivitätsfehler > 0,04
Bits 6–7: LST-Fehlerflag
0: Durchschnittlicher LST-Fehler <= 1 K
1: Durchschnittlicher LST-Fehler <= 2 K
2: Durchschnittlicher LST-Fehler <= 3 K
3: Durchschnittlicher LST-Fehler > 3 K
Night_view_time
Std.
0
240
0,1
1.000 Meter
Ortszeit der nächtlichen Beobachtung
Night_view_angle
Grad
0
130
-65
1.000 Meter
Zenitwinkel der Nachtbeobachtung ansehen
Emis_31
1
255
0,002
0.49
1.000 Meter
Emissivität von Band 31
Emis_32
1
255
0,002
0.49
1.000 Meter
Emissivität des Bandes 32
Clear_day_cov
1
65535
0,0005
1.000 Meter
Tagesabdeckung bei klarem Himmel
Clear_night_cov
1
65535
0,0005
1.000 Meter
Abdeckung bei klarem Nachthimmel
Nutzungsbedingungen
Nutzungsbedingungen
Für MODIS-Daten und ‑Produkte, die über das LP DAAC bezogen werden, gelten keine Einschränkungen für die spätere Nutzung, den Verkauf oder die Weitergabe.
Das Produkt „MOD11A1 V6“ bietet tägliche Werte für die Landoberflächentemperatur (Land Surface Temperature, LST) und den Emissionsgrad in einem Raster von 1.200 × 1.200 Kilometern. Der Temperaturwert wird aus dem MOD11_L2-Swath-Produkt abgeleitet. Oberhalb von 30 Grad Breitengrad können für einige Pixel mehrere Beobachtungen vorliegen, bei denen die Kriterien für wolkenlosen Himmel erfüllt sind. Wenn dies der Fall ist, …
[[["Leicht verständlich","easyToUnderstand","thumb-up"],["Mein Problem wurde gelöst","solvedMyProblem","thumb-up"],["Sonstiges","otherUp","thumb-up"]],[["Benötigte Informationen nicht gefunden","missingTheInformationINeed","thumb-down"],["Zu umständlich/zu viele Schritte","tooComplicatedTooManySteps","thumb-down"],["Nicht mehr aktuell","outOfDate","thumb-down"],["Problem mit der Übersetzung","translationIssue","thumb-down"],["Problem mit Beispielen/Code","samplesCodeIssue","thumb-down"],["Sonstiges","otherDown","thumb-down"]],[],[],["This dataset offers daily land surface temperature (LST) and emissivity data from the MOD11A1 V6 product, spanning from February 24, 2000, to November 15, 2022. The data, provided by NASA LP DAAC, is on a 1200x1200 km grid with a 1km pixel size, and can be accessed via Earth Engine using `ee.ImageCollection(\"MODIS/006/MOD11A1\")`. It includes both daytime and nighttime LST values, quality indicators, observation times, and emissivity bands.\n"]]