Page Summary
-
This dataset provides thrice-monthly Palmer Drought Severity Index estimates for the contiguous United States from 1979 to 2020 at a high spatial resolution.
-
The index is calculated using precipitation and potential evapotranspiration data derived from the gridded meteorological dataset of Abatzoglou (2013).
-
Potential evapotranspiration is computed using the Penman-Montieth equation for a reference grass surface, and available soil water holding capacity is derived from the STATSGO soils database.
-
The dataset is available in early, provisional, and permanent statuses, with the permanent version being the most finalized.
-
Data for the first year of the record should be used sparingly due to spin-up of PDSI calculations.
- Dataset Availability
- 1979-03-01T00:00:00Z–2020-06-20T00:00:00Z
- Dataset Producer
- University of California Merced
- Cadence
- 10 Days
- Tags
Description
The Palmer Drought Severity Index dataset provides high spatial resolution (~4-km) thrice-monthly estimates of this widely used measure of integrated water supply and demand anomalies across the contiguous United States from 1979-present. The PDSI is calculated using precipitation and potential evapotranspiration derived from the gridded meteorological dataset of Abatzoglou (2013).
Potential evapotranspiration is computed using the Penman-Montieth equation for a reference grass surface. Available soil water holding capacity in the top 2.5m of the soil was derived from the STATSGO soils database and used in the computations. Whereas PDSI has typically been computed on monthly timescales, we compute these data three-times a month to provide more timely updates. Due to the spin-up of PDSI calculations, data for the first year of record should be used sparingly.
This dataset contains provisional products that are replaced with updated versions when the complete source data become available. Products can be distinguished by the value of the 'status' property. At first, assets are ingested with status='early'. After several days, they are replaced by assets with status='provisional'. After about 2 months, they are replaced by the final assets with status='permanent'.
Bands
Bands
Pixel size: 4638.3 meters (all bands)
| Name | Min | Max | Pixel Size | Description |
|---|---|---|---|---|
pdsi |
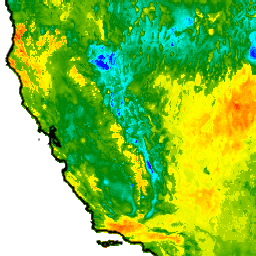
-11.94* | 17.92* | 4638.3 meters | Possible values: 4.0 or more (extremely wet), 3.0 to 3.99 (very wet), 2.0 to 2.99 (moderately wet), 1.0 to 1.99 (slightly wet), 0.5 to 0.99 (incipient wet spell), 0.49 to -0.49 (near normal), -0.5 to -0.99 (incipient dry spell), -1.0 to -1.99 (mild drought), -2.0 to -2.99 (moderate drought), -3.0 to -3.99 (severe drought), or -4.0 or less (extreme drought). |
Image Properties
Image Properties
| Name | Type | Description |
|---|---|---|
| status | STRING | 'early', 'provisional', or 'permanent' |
Terms of Use
Terms of Use
This work (METDATA, by John Abatzoglou) is in the public domain and is free of known copyright restrictions. Users should properly cite the source used in the creation of any reports and publications resulting from the use of this dataset and note the date when the data was acquired.
Citations
Abatzoglou J.T., R. Barbero, J.W. Wolf, Z. Holden (2014), Tracking interannual streamflow variability with drought indices in the Pacific Northwest, US, Journal of Hydrometeorology, 15, 1900-1912.
Explore with Earth Engine
Code Editor (JavaScript)
var dataset = ee.ImageCollection('IDAHO_EPSCOR/PDSI')
                  .filter(ee.Filter.date('2018-07-01', '2018-08-01'));
var pdsi = dataset.select('pdsi');
var pdsiVis = {
  min: -5.0,
  max: 10.0,
  palette: ['red', 'yellow', 'green', 'cyan', 'blue'],
};
Map.setCenter(-115.356, 38.686, 5);
Map.addLayer(pdsi, pdsiVis, 'PDSI');