Page Summary
-
The dataset provides annual estimates of carbon (C) and nitrous oxide (N2O) emissions from agricultural drainage of organic soils globally from 1992-2018.
-
Data is available at approximately 1 km resolution and follows IPCC guidelines using histosols as a proxy for organic soils and incorporating land cover, soil, and climate information.
-
Organic soils, while covering only 3% of land, hold up to 30% of soil carbon, and drainage for agriculture significantly contributes to greenhouse gas emissions.
-
The data is based on FAOSTAT datasets and is freely available for scientific and research purposes.
- Dataset Availability
- 1992-01-01T00:00:00Z–2018-01-01T00:00:00Z
- Dataset Producer
- FAO UN
- Cadence
- 1 Year
- Tags
Description
The two related FAO datasets on Drained Organic Soils provide estimates of:
DROSA-A: area of Organic Soils (in hectares) drained for agricultural activities (cropland and grazed grassland)
DROSE-A: carbon (C) and nitrous oxide (N2O) estimates (in gigagrams) from the agricultural drainage of organic soils under these land uses.
Annual data are available at 0.0083333 X 0.0083333 resolution (~1 km at the equator), with global coverage for the period 1992 - 2018.
FAOSTAT estimates follow the Intergovernmental Panel on Climate Change Guidelines (IPCC) and use histosols as proxy for the presence of organic soils and annual land cover maps as time- dependent component. Additionally, soils characteristics, land use, and climate information are applied in the analysis. The carbon emissions can be converted to CO2, multiplying pixel values by the ratio of the molecular weight of carbon dioxide (CO2) to that of C (44/12).
Organic soils develop in wet soil ecosystems. They include tropical and boreal peatlands, high-latitude bogs, ferns, and mires. Organic soils cover globally a mere 3 percent of the terrestrial land area but represent up to 30 percent of the total soil carbon, thus playing an important role in maintaining the earth's carbon balance. Agriculture is a major cause of drainage of organic soils around the world. Drainage exposes to aerobic conditions the organic matter of organic soils that oxidizes releasing large amounts of harmful greenhouse gases (GHG) to the atmosphere.
DROSA-A and DROSE-A are the basis for country and regional statistics on drained organic soils disseminated in three FAOSTAT datasets (Cultivation of Organic Soils; Cropland; and Grassland).
Bands
Bands
Pixel size: 927.67 meters (all bands)
| Name | Units | Pixel Size | Description |
|---|---|---|---|
croplandc |
Gg | 927.67 meters | C emissions from cropland organic soils |
croplandn2o |
Gg | 927.67 meters | N2O emissions from cropland organic soils |
grasslandc |
Gg | 927.67 meters | C emissions from grassland organic soils |
grasslandn2o |
Gg | 927.67 meters | N2O emissions from grassland organic soils |
Terms of Use
Terms of Use
The Food and Agriculture Organization of the United Nations (FAO) is mandated to collect, analyze, interpret, and disseminate information related to nutrition, food, and agriculture. In this regard, it publishes a number of databases on topics related to FAO's mandate, and encourages the use of them for scientific and research purposes. Consistent with the principles of openness and sharing envisioned under the Open Data Licensing For Statistical Databases, and consistent with the mandate of FAO, data on GHG emissions from agriculture activities on organic soils as part of FAOSTAT - FAO's database on Food and Agriculture data, is available free to the user community.
Citations
FAO 2020. Drained organic soils 1990 - 2019. Global, regional and country trends. FAOSTAT Analytical Brief Series No 4, FAO, Rome. http://www.fao.org/3/cb0489en/cb0489en.pdf
Conchedda, G. and Tubiello, F. N.: Drainage of organic soils and GHG emissions: Validation with country data, Earth Syst. Sci. Data Discuss. doi:10.5194/essd-12-3113-2020, 2020
DOIs
Explore with Earth Engine
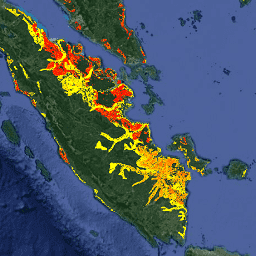
Code Editor (JavaScript)
var dataset = ee.ImageCollection('FAO/GHG/1/DROSE_A');

var visualization = {
  bands: ['croplandc'],
  min: 0,
  max: 1,
  palette: ['yellow', 'red']
};

Map.setCenter(108.0, -0.4, 6);

Map.addLayer(dataset, visualization, 'Cropland C emissions (Annual)');