Page Summary
-
This dataset provides 6-day, Near-Realtime (NRT) forecasts of wave model fields from the ECMWF Integrated Forecasting System (IFS) at 0.25 degree resolution.
-
New products are released twice daily as a subset of the ECMWF realtime forecast data, specifically a "Short-Cutoff" stream with a shorter forecast range.
-
The dataset includes bands for mean zero crossing wave period, significant height of combined wind waves and swell, mean wave direction, peak wave period, and mean wave period.
-
Data is available from 2024-11-12T18:00:00Z to 2025-10-17T06:00:00Z and is updated every 12 hours.
-
This dataset can be used commercially with proper attribution and is available in Earth Engine starting with the implementation of Cycle 49r1.
- Dataset Availability
- 2024-11-12T18:00:00Z–2026-07-24T06:00:00Z
- Dataset Producer
- ECMWF
- Cadence
- 12 Hours
- Tags
Description
This dataset contains 6-day forecasts of the wave model fields generated by the ECMWF Integrated Forecasting System (IFS) at 0.25 degree resolution. We refer to these as Near-Realtime (NRT) because new products are released twice a day after the release of the ECMWF realtime forecast data, of which this is a subset. This is a "Short-Cutoff" stream, meaning the forecasts have a shorter range than the standard IFS WAVE forecasts. Data may be distributed and used commercially with proper attribution.
Products are available in Earth Engine starting with the implementation of Cycle 49r1 on 2024-11-12; earlier products are not included. For general information about how to use ECMWF NRT datasets, see their user documentation. Sources files are available in the Google Cloud marketplace.
Bands
Bands
Pixel size: 28000 meters (all bands)
| Name | Units | Min | Max | Pixel Size | Description |
|---|---|---|---|---|---|
mean_zero_crossing_wave_period_sfc |
seconds | 0.889602* | 17.573* | 28000 meters | The mean length of time between occasions where the sea/ocean surface crosses mean sea level. |
significant_height_of_combined_wind_waves_and_swell_sfc |
m | 0.0172079* | 15.5856* | 28000 meters | The average height of the highest third of surface ocean/sea waves generated by wind and swell. It represents the vertical distance between the wave crest and the wave trough. |
mean_wave_direction_sfc |
deg | 0 | 360 | 28000 meters | The mean direction of ocean/sea surface waves relative to the geographic location of the north pole (e.g., 0 means "coming from the north" and 90 "coming from the east"). |
peak_wave_period_sfc |
seconds | 1.03074* | 23.7889* | 28000 meters | The period of the most energetic ocean waves generated by local winds and associated with swell. The wave period is the average time it takes for two consecutive wave crests, on the surface of the ocean/sea, to pass through a fixed point. |
mean_wave_period_sfc |
seconds | 1.04148* | 18.3643* | 28000 meters | The average time it takes for two consecutive wave crests, on the surface of the ocean/sea, to pass through a fixed point. |
Image Properties
Image Properties
| Name | Type | Description |
|---|---|---|
| creation_day | INT | Day of the month when the forecast was created. |
| creation_doy | INT | Day of the year when the forecast was created. |
| creation_hour | INT | Hour of the day when the forecast was created. |
| creation_month | INT | Month of the year when the forecast was created. |
| creation_time | INT | Time, in unix epoch milliseconds, when forecast was created. |
| creation_year | INT | Year when the forecast was created. |
| forecast_hours | INT | Hours into the future, relative to |
| forecast_time | INT | Time, in unix epoch milliseconds, of the forecast. |
| model | STRING | The ECMWF forecasting model:
|
| stream | STRING | The stream from which the variables were fetched. See the full list here. |
Terms of Use
Terms of Use
DOIs
Explore with Earth Engine
Code Editor (JavaScript)
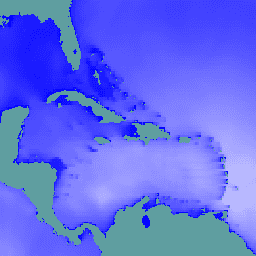
// Observe the ocean in the vicinity of the Caribbean islands and
// Gulf coast.
var aoi = ee.Geometry.Polygon(
    [[
      [-100.6052734375, 31.751243295508836],
      [-100.6052734375, 6.080143483787566],
      [-57.18730468750001, 6.080143483787566],
      [-57.18730468750001, 31.751243295508836]
    ]],
    null, false);

// Extract significant wave height forecasts made at noon on 2025/6/11.
var wave =
    ee.ImageCollection('ECMWF/NRT_FORECAST/IFS/WAVE')
        .filter(ee.Filter.eq('creation_doy', 162))
        .filter(ee.Filter.eq('creation_hour', 12))
        .sort('forecast_hours')
        .select('significant_height_of_combined_wind_waves_and_swell_sfc');

// Display the observations at forecast hour 0 on the map.
var hour0 = wave.first().clip(aoi);
Map.centerObject(hour0);
Map.addLayer(hour0, {min: 0, max: 5}, 'sig height fc=0');

// Animate the wave height forecasts over time.
var videoArgs = {
  dimensions: 540,
  region: aoi,
  framesPerSecond: 7,
  crs: 'EPSG:3857',
  min: 0,
  max: 5,
};
print(ui.Thumbnail(wave, videoArgs));