Page Summary
-
This dataset provides Penman-Monteith-Leuning Evapotranspiration V2 (PML_V2) products, including evapotranspiration, its three components, and gross primary production (GPP).
-
The data is available at 500m and 8-day resolution from 2002 to 2017, covering a spatial range from -60°S to 90°N.
-
Key advantages include coupled estimates of transpiration and GPP and the partitioning of ET into three components.
-
The dataset is licensed under the CC-BY 4.0 license and has been superseded by a newer version.
- Dataset Availability
- 2002-07-04T00:00:00Z–2017-12-27T00:00:00Z
- Dataset Producer
- PML_V2
- Cadence
- 8 Days
- Tags
Description
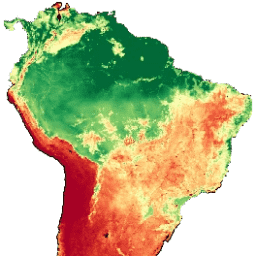
Penman-Monteith-Leuning Evapotranspiration V2 (PML_V2) products include evapotranspiration (ET), its three components, and gross primary product (GPP) at 500m and 8-day resolution during 2002-2017 and with spatial range from -60°S to 90°N. The major advantages of the PML_V2 products are:
- coupled estimates of transpiration and GPP via canopy conductance (Gan et al., 2018; Zhang et al., 2019)
- partitioning ET into three components: transpiration from vegetation, direct evaporation from the soil and vaporization of intercepted rainfall from vegetation (Zhang et al., 2016).
The PML_V2 products perform well against observations at 95 flux sites across the globe, and are similar to or noticeably better than major state-of-the-art ET and GPP products widely used by water and ecology research communities (Zhang et al., 2019).
Bands
Bands
Pixel size: 500 meters (all bands)
| Name | Units | Min | Max | Pixel Size | Description |
|---|---|---|---|---|---|
GPP |
gC m-2 d-1 | 0* | 39.01* | 500 meters | Gross primary production |
Ec |
mm/d | 0* | 15.33* | 500 meters | Vegetation transpiration |
Es |
mm/d | 0* | 8.2* | 500 meters | Soil evaporation |
Ei |
mm/d | 0* | 12.56* | 500 meters | Interception from vegetation canopy |
ET_water |
mm/d | 0* | 20.11* | 500 meters | Evaporation from water bodies, snow, and ice. Calculated using the Penman equation, which is considered a good estimate of actual evaporation for these surfaces. |
Terms of Use
Terms of Use
Acknowledgements
Whenever PML datasets are used in a scientific publication, the given references should be cited.
License
The dataset is licensed under the CC-BY 4.0 license.
Citations
Zhang, Y., Kong, D., Gan, R., Chiew, F.H.S., McVicar, T.R., Zhang, Q., and Yang, Y., 2019. Coupled estimation of 500m and 8-day resolution global evapotranspiration and gross primary production in 2002-2017. Remote Sens. Environ. 222, 165-182, doi:10.1016/j.rse.2018.12.031
Gan, R., Zhang, Y.Q., Shi, H., Yang, Y.T., Eamus, D., Cheng, L., Chiew, F.H.S., Yu, Q., 2018. Use of satellite leaf area index estimating evapotranspiration and gross assimilation for Australian ecosystems. Ecohydrology, doi:10.1002/eco.1974
Zhang, Y., Peña-Arancibia, J.L., McVicar, T.R., Chiew, F.H.S., Vaze, J., Liu, C., Lu, X., Zheng, H., Wang, Y., Liu, Y.Y., Miralles, D.G., Pan, M., 2016. Multi-decadal trends in global terrestrial evapotranspiration and its components. Sci. Rep. 6, 19124. doi:10.1038/srep19124
DOIs
Explore with Earth Engine
Code Editor (JavaScript)
var dataset = ee.ImageCollection('CAS/IGSNRR/PML/V2');

var visualization = {
  bands: ['GPP'],
  min: 0.0,
  max: 9.0,
  palette: [
    'a50026', 'd73027', 'f46d43', 'fdae61', 'fee08b', 'ffffbf',
    'd9ef8b', 'a6d96a', '66bd63', '1a9850', '006837',
  ]
};

Map.setCenter(0.0, 15.0, 2);

Map.addLayer(
    dataset, visualization, 'PML_V2 0.1.4 Gross Primary Product (GPP)');