
Page Summary
-
Use
ngrokto expose your locally running Google Chat app for development and testing purposes. -
Google provides sample code and setup instructions for Node.js, Python, and Java to assist in debugging.
-
Configure your Google Chat app to use the
ngrok-provided URL as its HTTP endpoint for receiving requests. -
Debugging tools like Visual Studio Code and
ngrok's request replay functionality help streamline the development process. -
Remote debugging involves setting up an SSH tunnel and configuring your IDE to connect to the remote environment.
As a Google Chat apps developer you might need to debug code to test changes or troubleshoot complex issues. Debugging Chat apps can be done in many different ways depending on your app's architecture, what the app does, how your app is deployed, and your preferences.
This page explains how to debug an HTTP Chat app using ngrok, which is a unified ingress platform that you can use to test local development environments. In this guide, you test code changes in a local environment and troubleshoot issues in a remote environment.
Debug from local development environment
In this section, you interact with your Chat app that executes in your local environment.

Figure 1. Debug in a local development environment.
Workshop
Node.js
Python
Java
Prerequisites
Node.js
- Latest versions of
nodeandnpminstalled in your local environment. Latest version of
nodemoninstalled in your local environment, it's used for auto-reload purposes:npm install -g nodemonAn HTTP Chat app that's configured for messaging. You can follow the sections Prerequisites, Set up the environment, and Publish the app to Google Chat of the Quickstart guide. The only differences are that you need to set the App name to
Debug Appand the HTTP endpoint URL to anything such ashttp://example.com.An IDE set up in your local environment that can debug. We use the
Visual Studio CodeIDE and its default debugging features in this guide for illustration purposes.Gitinstalled in your local environment.A
ngrokaccount.
Python
- Latest version of
python3installed in your local environment. - Latest version of
pipandvirtualenvinstalled in your local environment, they are used to manage Python packages and virtual environments respectively. - An HTTP Chat app that's configured for
messaging. You can follow the sections
Prerequisites,
Set up the
environment,
and Publish the app to Google
Chat of the
Quickstart guide. The only
differences are that you need to set the App name to
Debug Appand the HTTP endpoint URL to anything such ashttp://example.com. - An IDE set up in your local environment that can debug. We use the
Visual Studio CodeIDE and its default debugging features in this guide for illustration purposes. Gitinstalled in your local environment.- A
ngrokaccount. - Latest version of
gcloudinstalled and initialized in your local environment.
Java
- Latest stable version of the
Java SE 11's JDKinstalled in your local environment. - Latest version of
Apache Maveninstalled in your local environment, it's used to manage Java projects. - An HTTP Chat app that's configured for
messaging. You can follow the sections
Prerequisites,
Set up the
environment,
and Publish the app to Google
Chat of the
Quickstart guide. The only
differences are that you need to set the App name to
Debug Appand the HTTP endpoint URL to anything such ashttp://example.com. - An IDE set up in your local environment that can debug. We use the
Visual Studio CodeIDE and its default debugging features in this guide for illustration purposes. Gitinstalled in your local environment.- A
ngrokaccount. - Latest version of
gcloudinstalled and initialized in your local environment.
Make the localhost service available publicly
You need to connect your local environment to the internet so that the
Chat app can access it. The ngrok application is used
to redirect HTTP requests made to a public URL to your local environment.
- In a browser in your local environment, sign in to your
ngrokaccount. - Install the application and set up your
authtokenin your local environment. - Create a static domain in your
ngrokaccount, it's referenced asNGROK_STATIC_DOMAINin the instructions of this guide.
Configure the Chat app
Configure the Chat app to send all its HTTP requests to your static domain.
In the Google API Console, open the Google Chat API page:
Click the Configuration tab.
Go to Interactive features > Connection settings and set the value of the text field HTTP endpoint URL to:
https://NGROK_STATIC_DOMAINReplace
NGROK_STATIC_DOMAINwith the static domain in yourngrokaccount.Click Save.

Figure 2. The Chat app sends all its HTTP requests
to the static domain. The ngrok public service acts as a bridge between the
Chat app and the application code that executes
locally.
Test the Chat app
You can locally deploy, configure, test, debug, and auto-reload your Chat app.
Node.js
Clone the
googleworkspace/google-chat-samplesrepository from GitHub to your local environment, it contains the code of the application to execute:git clone https://github.com/googleworkspace/google-chat-samples.gitFrom the
Visual Studio CodeIDE installed in your local environment, do the following:- In a new window, open the folder
google-chat-samples/node/basic-app. Configure the application for auto-reload debug by adding two scripts in the
package.jsonfile:{ ... "scripts": { ... "debug": "node --inspect index.js", "debug-watch": "nodemon --watch ./ --exec npm run debug" } ... }From the root directory, install the application:
npm installCreate and configure a launch named
Debug Watchthat triggers the scriptdebug-watchby creating the file.vscode/launch.jsonin the root directory:{ "version": "0.2.0", "configurations": [{ "type": "node", "request": "launch", "name": "Debug Watch", "cwd": "${workspaceRoot}", "runtimeExecutable": "npm", "runtimeArgs": ["run-script", "debug-watch"] }] }Add a breakpoint that pauses the HTTP request processing in the
index.jsfile, and start running and debugging with theDebug Watchconfiguration added before. The application is now running and listening for HTTP requests on the port9000.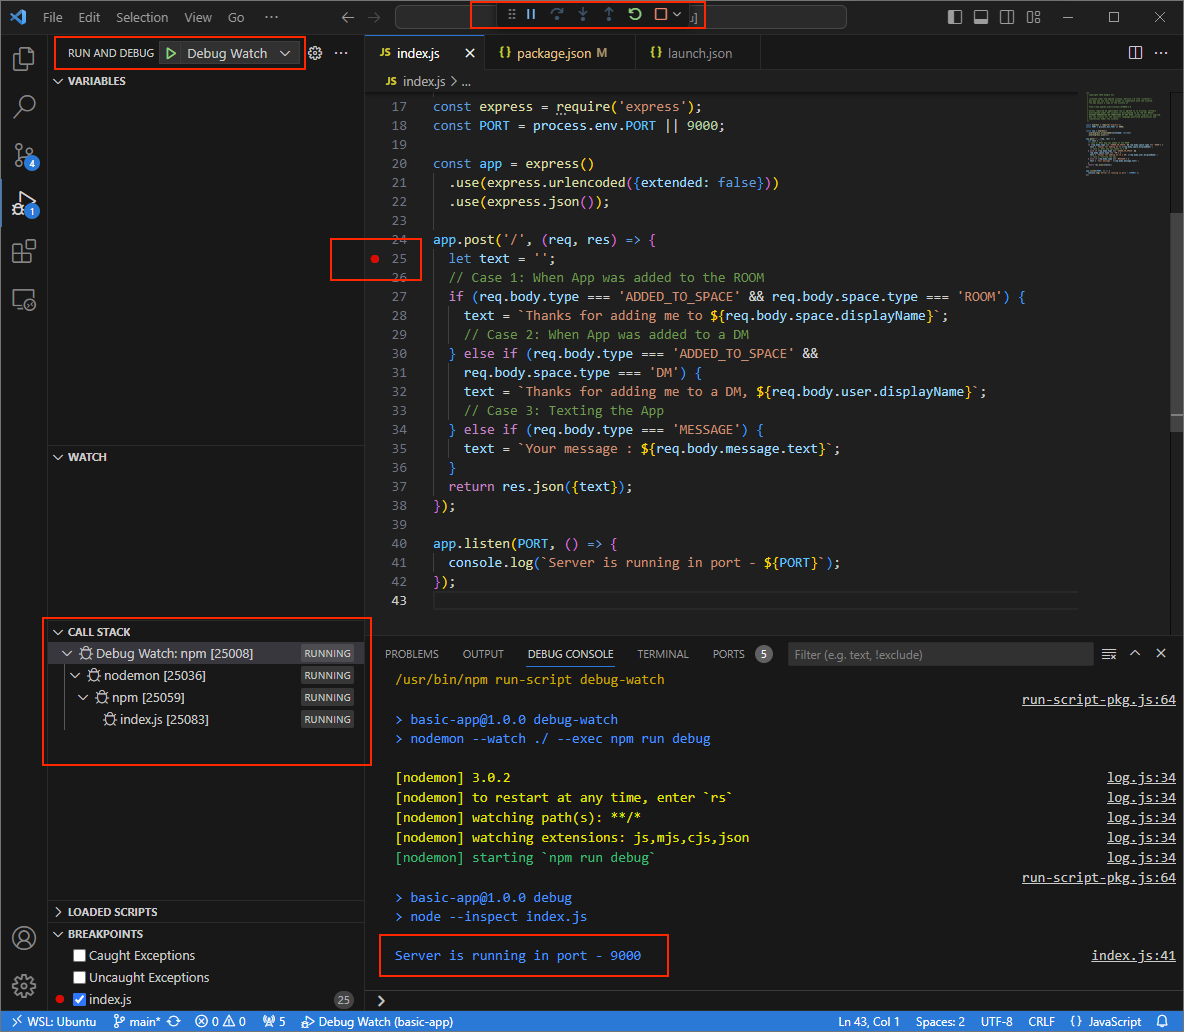
Figure 3. The application is running and listening for HTTP requests on the port
9000.
- In a new window, open the folder
Launch the
ngrokapplication in your local environment:ngrok http --domain=NGROK_STATIC_DOMAIN 9000Replace
NGROK_STATIC_DOMAINwith the static domain in yourngrokaccount. All requests are now redirected to your local environment and the port used by the application.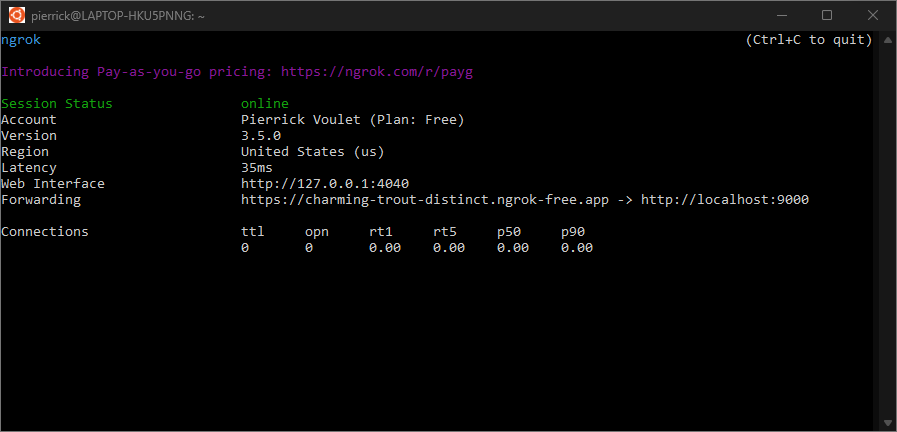
Figure 4. The terminal with
ngrokserver running and redirecting.A web interface is also started on your localhost by the
ngrokapplication, you can monitor all activities by opening it in a browser.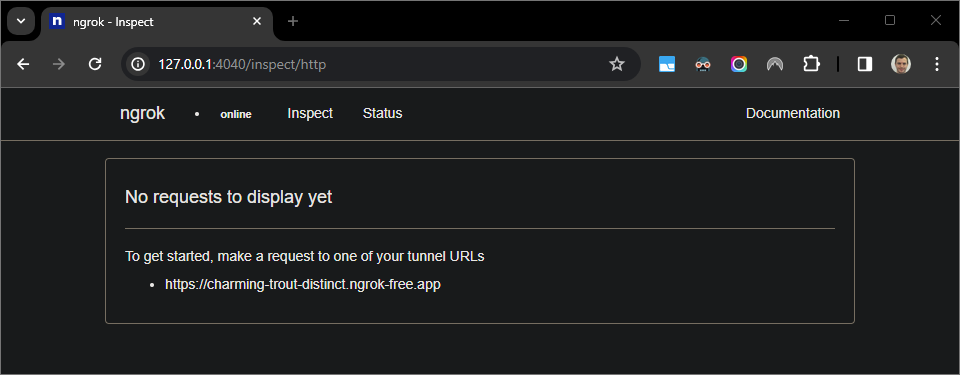
Figure 5. The web interface hosted by the
ngrokapplication showing no HTTP requests.Test your Chat app by sending it a direct message:
Open Google Chat.
Click New chat .
In the dialog, enter the name of your Chat app.
In the search results, find your Chat app, click Add > Chat.
In the direct message space, type
Helloand pressenter. Your Chat app does not reply because it's being actively debugged.
In the
Visual Studio Codein your local environment, you can see that the execution is paused at the breakpoint that was set.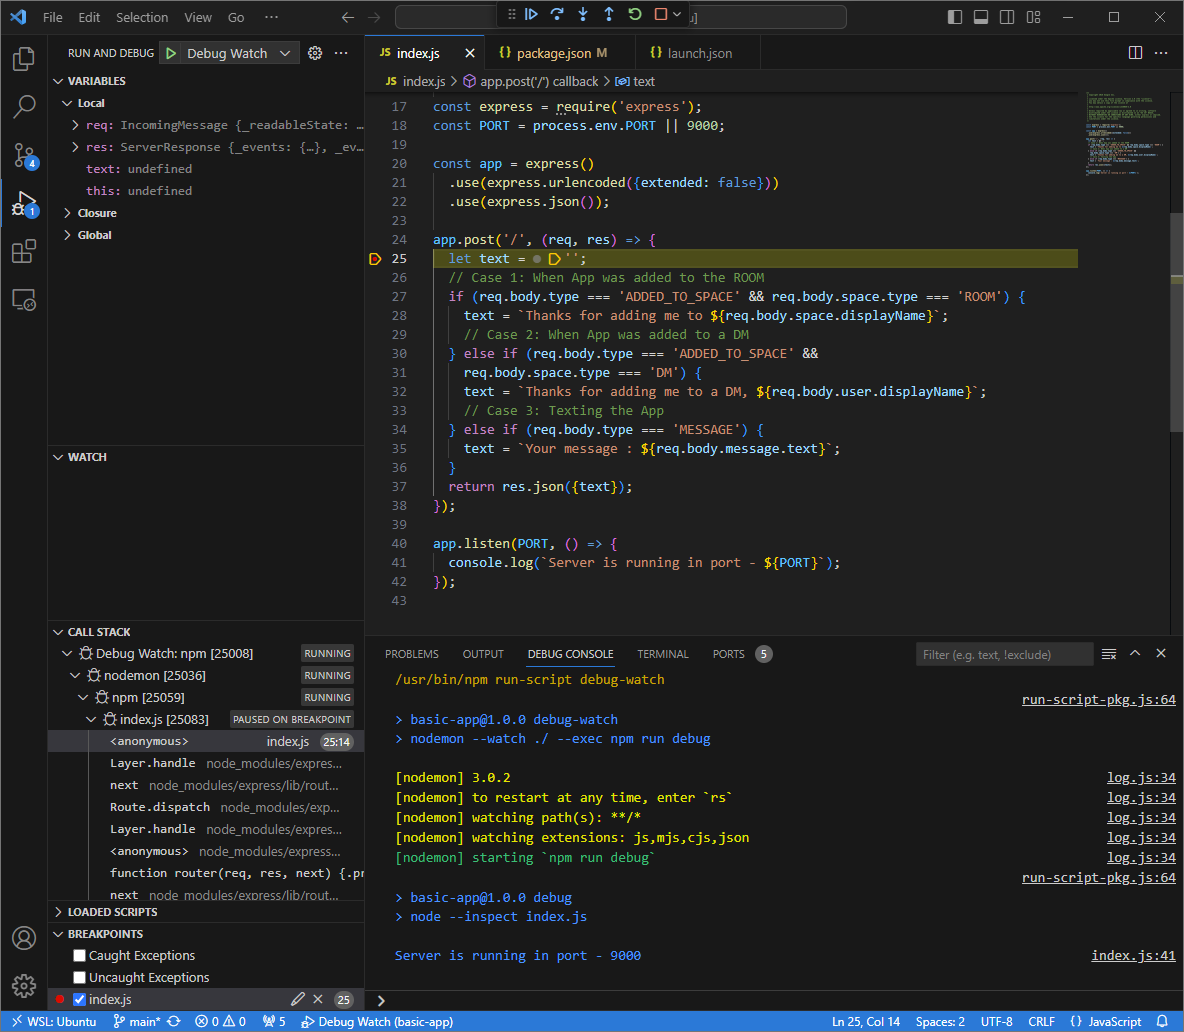
Figure 6. The execution is paused at the breakpoint that was set.
When you resume the execution from the debugger of
Visual Studio Codebefore Google Chat times out the Chat app repliesYour message : Hello.You can check the HTTP request and response logs from the web interface hosted by the
ngrokapplication in your local environment.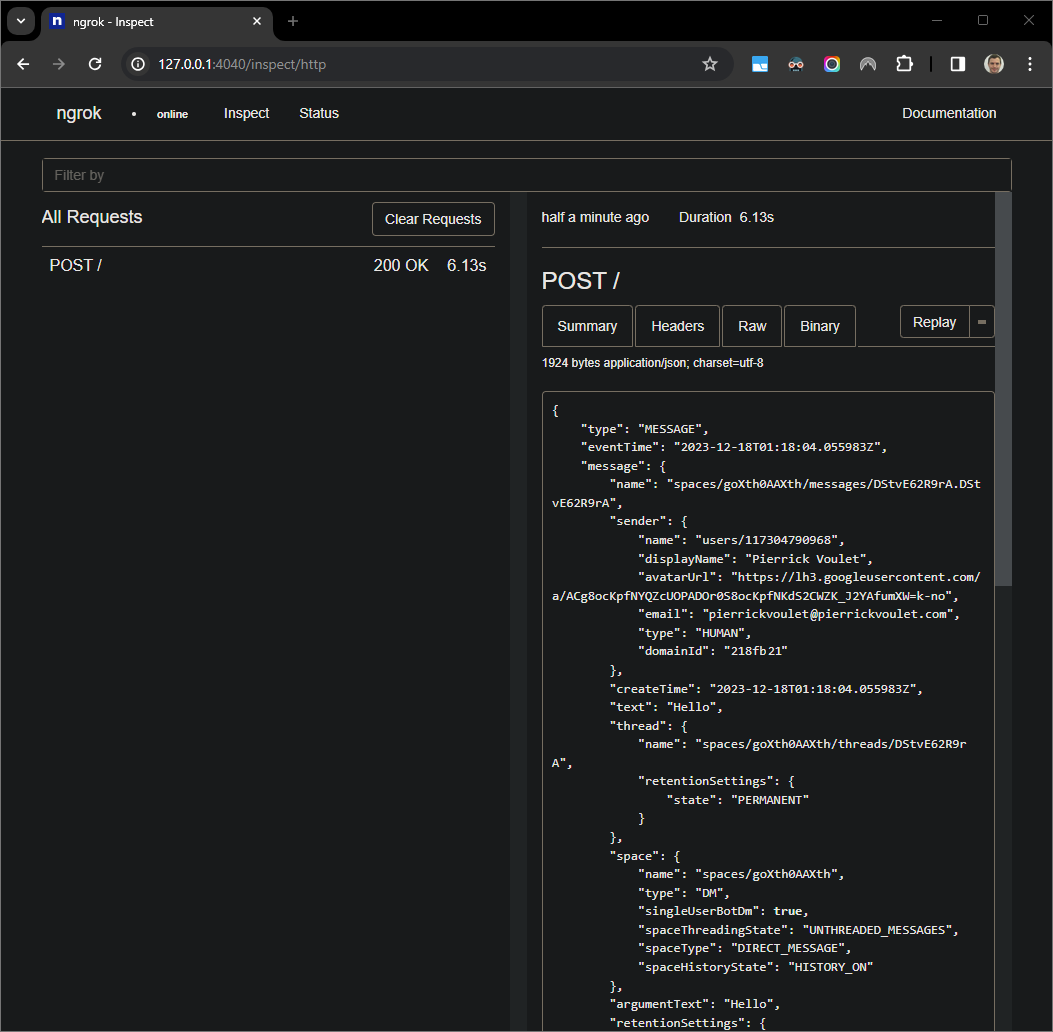
Figure 7. The HTTP request from the web interface hosted by the
ngrokapplication.To change the application behavior, replace
Your messagewithHere was your messageinline35of theindex.json. When you save the file,nodemonautomatically reloads the application with the updated source code andVisual Studio Coderemains in debug mode.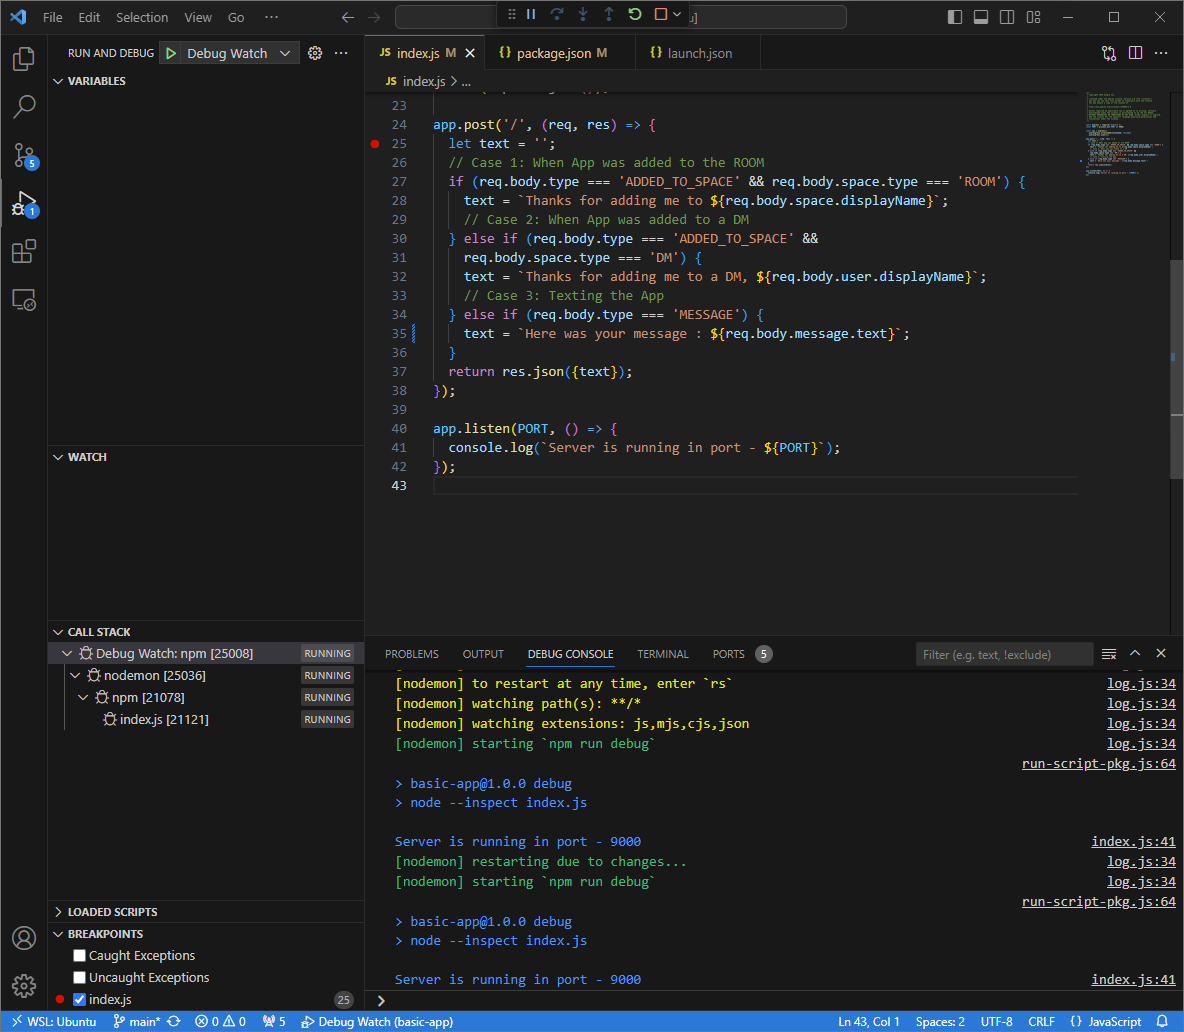
Figure 8. The application is running and listening for HTTP requests on the port
9000with the code change loaded.This time, instead of sending a second message
Helloin the space, you can select the last HTTP request logged on the web interface hosted by thengrokapplication in your local environment and clickReplay. Same as last time, your Chat app does not reply because it's being actively debugged.When you resume the execution from the debugger of
Visual Studio Codeyou can see from the web interface hosted by thengrokapplication in your local environment that the application generates a response with the updated version of the messageHere was your message : Hello.
Python
Acquire new user credentials to use for Application Default Credentials:
gcloud config set project PROJECT_IDgcloud auth application-default loginReplace
PROJECT_IDwith the project ID for the Cloud project of the app.Clone the
googleworkspace/google-chat-samplesrepository from GitHub to your local environment, it contains the application code:git clone https://github.com/googleworkspace/google-chat-samples.gitFrom the
Visual Studio CodeIDE installed in your local environment, do the following:- In a new window, open the folder
google-chat-samples/python/avatar-app. Create a new virtual environment for Python
envand activate it:virtualenv envsource env/bin/activateInstall all project dependencies using
pipin the virtual environment:pip install -r requirements.txtCreate the file
.vscode/launch.jsonin the root directory and configure a launch namedDebug Watchthat triggers the application from the modulefunctions-frameworkon port9000in debug mode on the virtual environmentenv:{ "version": "0.2.0", "configurations": [{ "type": "python", "request": "launch", "name": "Debug Watch", "python": "${workspaceFolder}/env/bin/python3", "module": "functions_framework", "args": [ "--target", "avatar_app", "--port", "9000", "--debug" ] }] }Add a breakpoint that pauses the HTTP request processing in the
main.pyfile, and start running and debugging with theDebug Watchconfiguration added before. The application is now running and listening for HTTP requests on the port9000.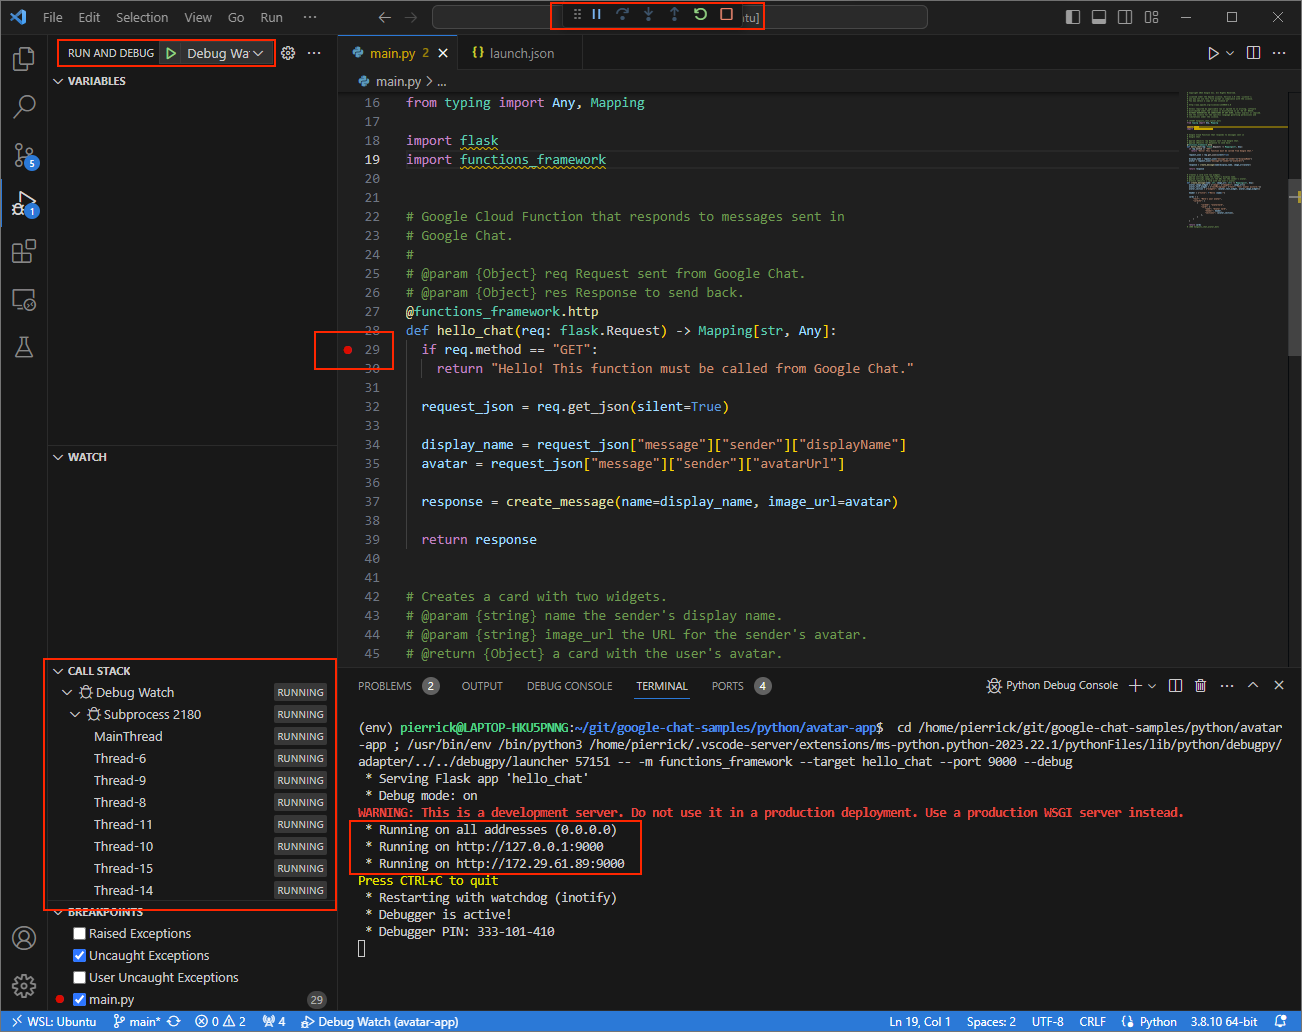
Figure 3. The application is running and listening for HTTP requests on the port
9000.
- In a new window, open the folder
Launch the
ngrokapplication in your local environment:ngrok http --domain=NGROK_STATIC_DOMAIN 9000Replace
NGROK_STATIC_DOMAINwith the static domain in yourngrokaccount. All requests are now redirected to your local environment and the port used by the application.Figure 4. The terminal with
ngrokserver running and redirecting.A web interface is also started on your localhost by the
ngrokapplication, you can monitor all activities by opening it in a browser.Figure 5. The web interface hosted by the
ngrokapplication showing no HTTP requests.Test your Chat app by sending it a direct message:
Open Google Chat.
Click New chat .
In the dialog, enter the name of your Chat app.
In the search results, find your Chat app, click Add > Chat.
In the direct message space, type
Hey!and pressenter. Your Chat app doesn't reply because it's being actively debugged.
In the
Visual Studio Codein your local environment, you can see that the execution is paused at the breakpoint that was set.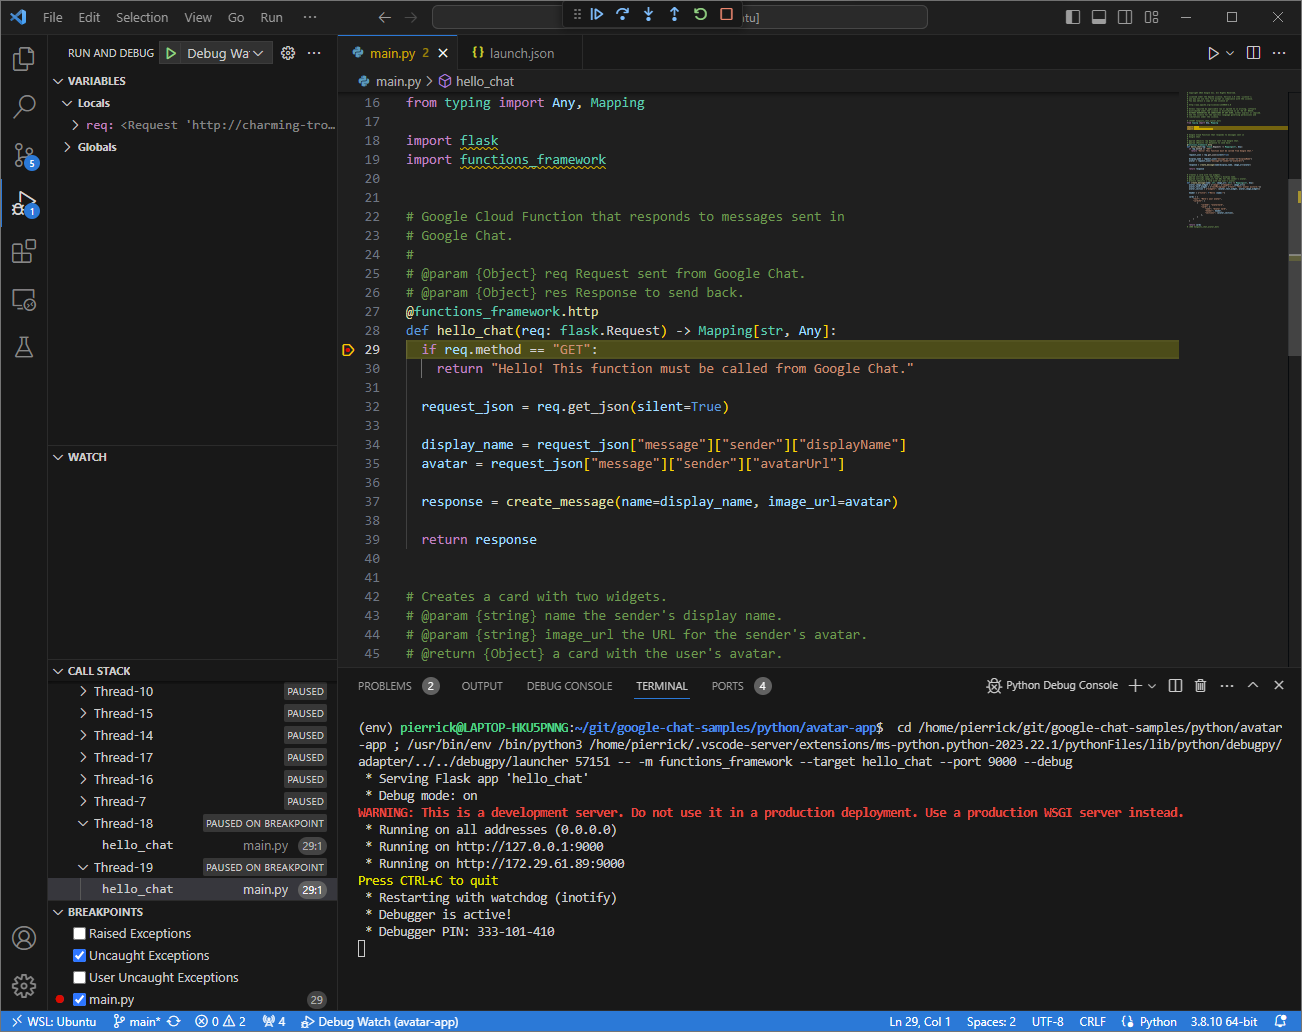
Figure 6. The execution is paused at the breakpoint that was set.
When you resume the execution from the debugger of
Visual Studio Codebefore Google Chat times out the Chat app replies with your name and avatar picture in the message.You can check the HTTP request and response logs from the web interface hosted by the
ngrokapplication in your local environment.
Figure 7. The HTTP request from the web interface hosted by the
ngrokapplication.To change the application behavior, replace
HellowithHeyinline51of themain.pyfile. When you save the file,Visual Studio Codeautomatically reloads the application with the updated source code and remains in debug mode.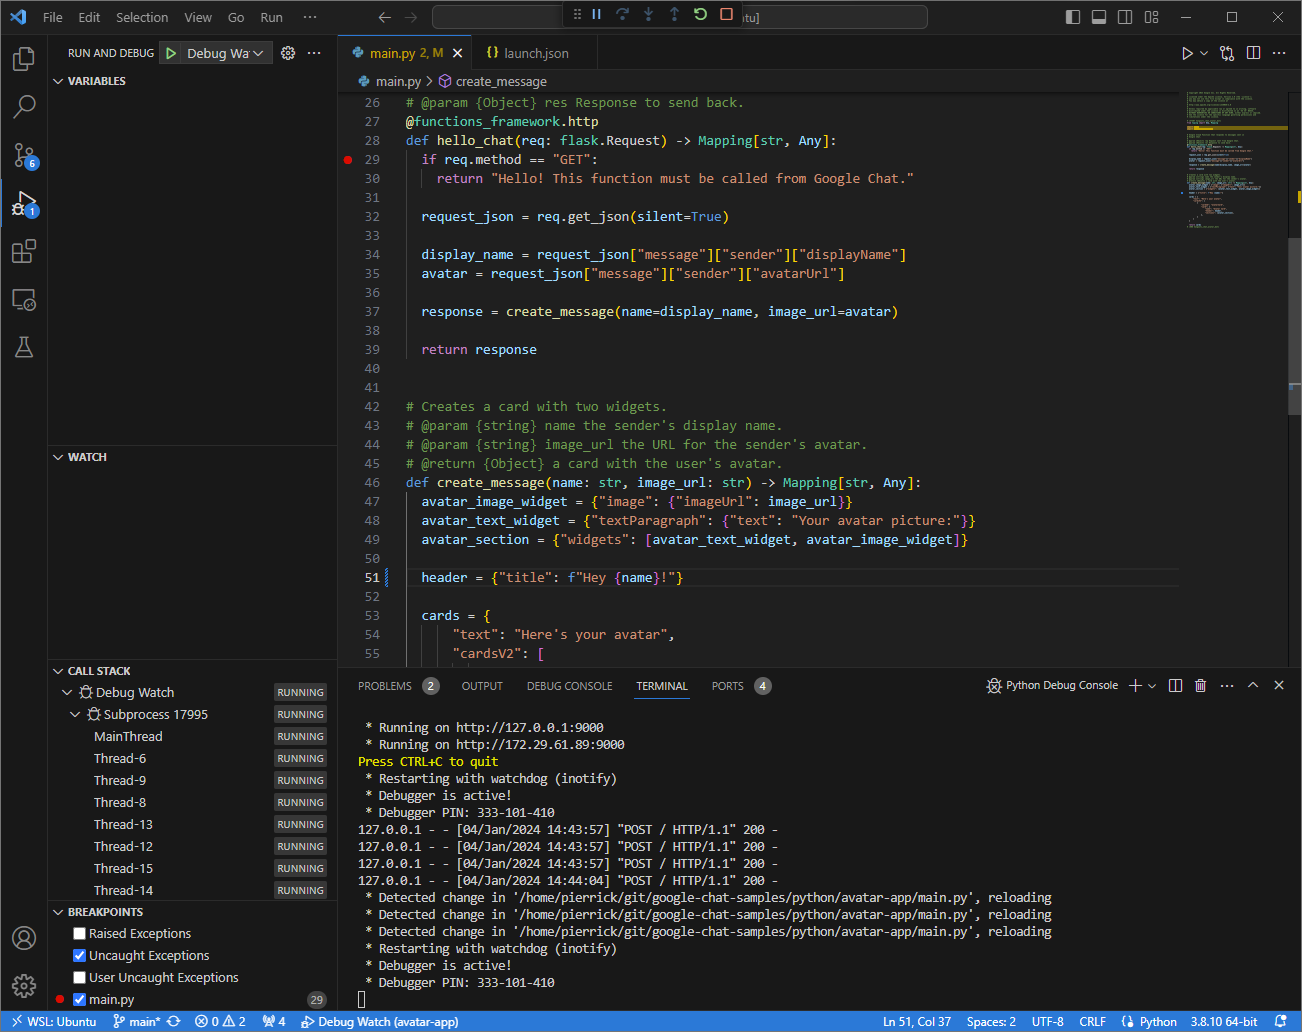
Figure 8. The application is running and listening for HTTP requests on the port
9000with the code change loaded.This time, instead of sending a second message
Hey!in the space, you can select the last HTTP request logged on the web interface hosted by thengrokapplication in your local environment and clickReplay. Same as last time, your Chat app doesn't reply because it's being actively debugged.When you resume the execution from the debugger of
Visual Studio Codeyou can see from the web interface hosted by thengrokapplication in your local environment that the application generates a response with the updated version of the message.
Java
Acquire new user credentials to use for Application Default Credentials:
gcloud config set project PROJECT_IDgcloud auth application-default loginReplace
PROJECT_IDwith the project ID for the Cloud project of the app.Clone the
googleworkspace/google-chat-samplesrepository from GitHub in your local environment, it contains the application code:git clone https://github.com/googleworkspace/google-chat-samples.gitFrom the
Visual Studio CodeIDE installed in your local environment, do the following:- In a new window, open the folder
google-chat-samples/java/avatar-app. Configure the Maven project to run the application
Appon port9000locally by adding the Google Cloud Functions Framework build pluginfunction-maven-pluginin thepom.xmlfile:... <plugin> <groupId>com.google.cloud.functions</groupId> <artifactId>function-maven-plugin</artifactId> <version>0.11.0</version> <configuration> <functionTarget>App</functionTarget> <port>9000</port> </configuration> </plugin> ...You can now launch it locally in debug mode:
mvnDebug function:run
Preparing to execute Maven in debug mode
Listening for transport dt_socket at address: 8000
Create the file
.vscode/launch.jsonin the root directory and configure a launch namedRemote Debug Watchthat attaches to the application previously launched with port8000:{ "version": "0.2.0", "configurations": [{ "type": "java", "request": "attach", "name": "Remote Debug Watch", "projectName": "http-function", "hostName": "localhost", "port": 8000 }] }Add a breakpoint that pauses the HTTP request processing in the
App.javafile, and start attaching and debugging with theRemote Debug Watchconfiguration added before. The application is now running and listening for HTTP requests on the port9000.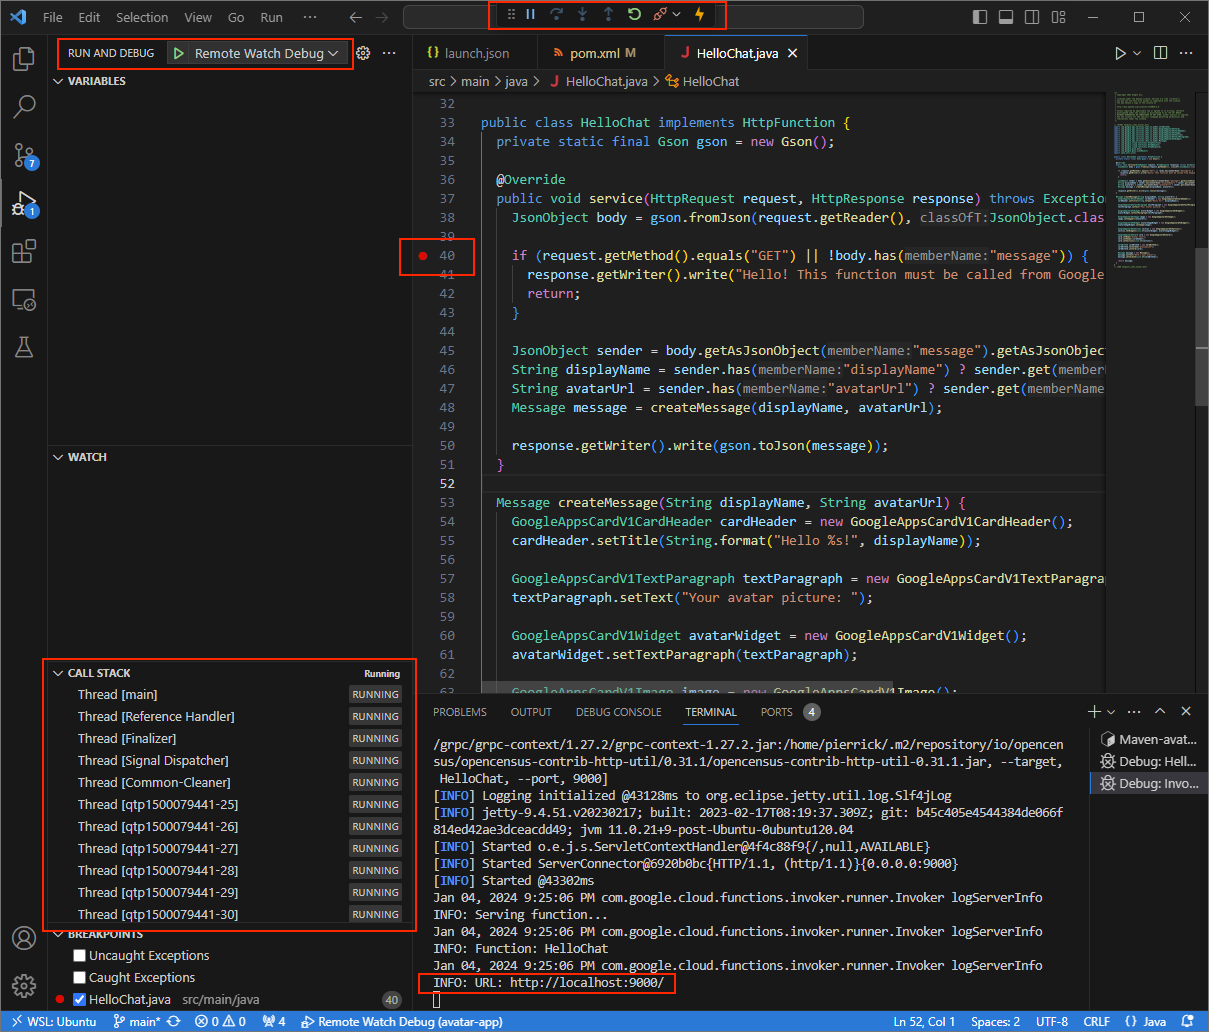
Figure 3. he application is running and listening for HTTP requests on the port
9000.
- In a new window, open the folder
Launch the
ngrokapplication in your local environment:ngrok http --domain=NGROK_STATIC_DOMAIN 9000Replace
NGROK_STATIC_DOMAINwith the static domain in yourngrokaccount. All requests are now redirected to your local environment and the port used by the application.Figure 4. The terminal with
ngrokserver running and redirecting.A web interface is also started on your localhost by the
ngrokapplication, you can monitor all activities by opening it in a browser.Figure 5. The web interface hosted by the
ngrokapplication showing no HTTP requests.Test your Chat app by sending it a direct message:
Open Google Chat.
Click New chat .
In the dialog, enter the name of your Chat app.
In the search results, find your Chat app, click Add > Chat.
In the direct message space, type
Hey!and pressenter. Your Chat app doesn't reply because it's being actively debugged.
In the
Visual Studio Codein your local environment, you can see that the execution is paused at the breakpoint that was set.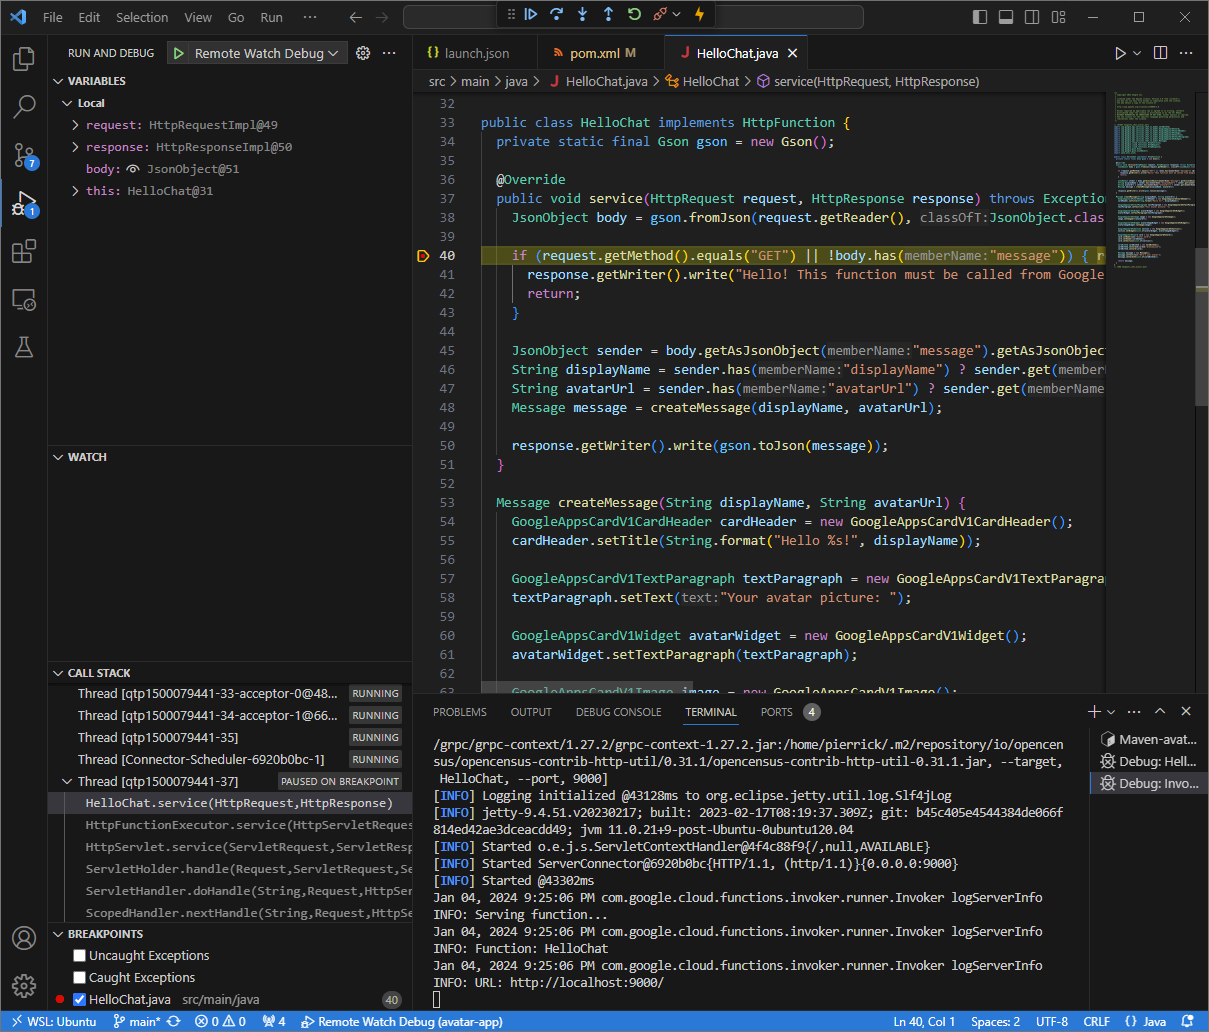
Figure 6. The execution is paused at the breakpoint that was set.
When you resume the execution from the debugger of
Visual Studio Codebefore Google Chat times out the Chat app replies with your name and avatar picture in the message.You can check the HTTP request and response logs from the web interface hosted by the
ngrokapplication in your local environment.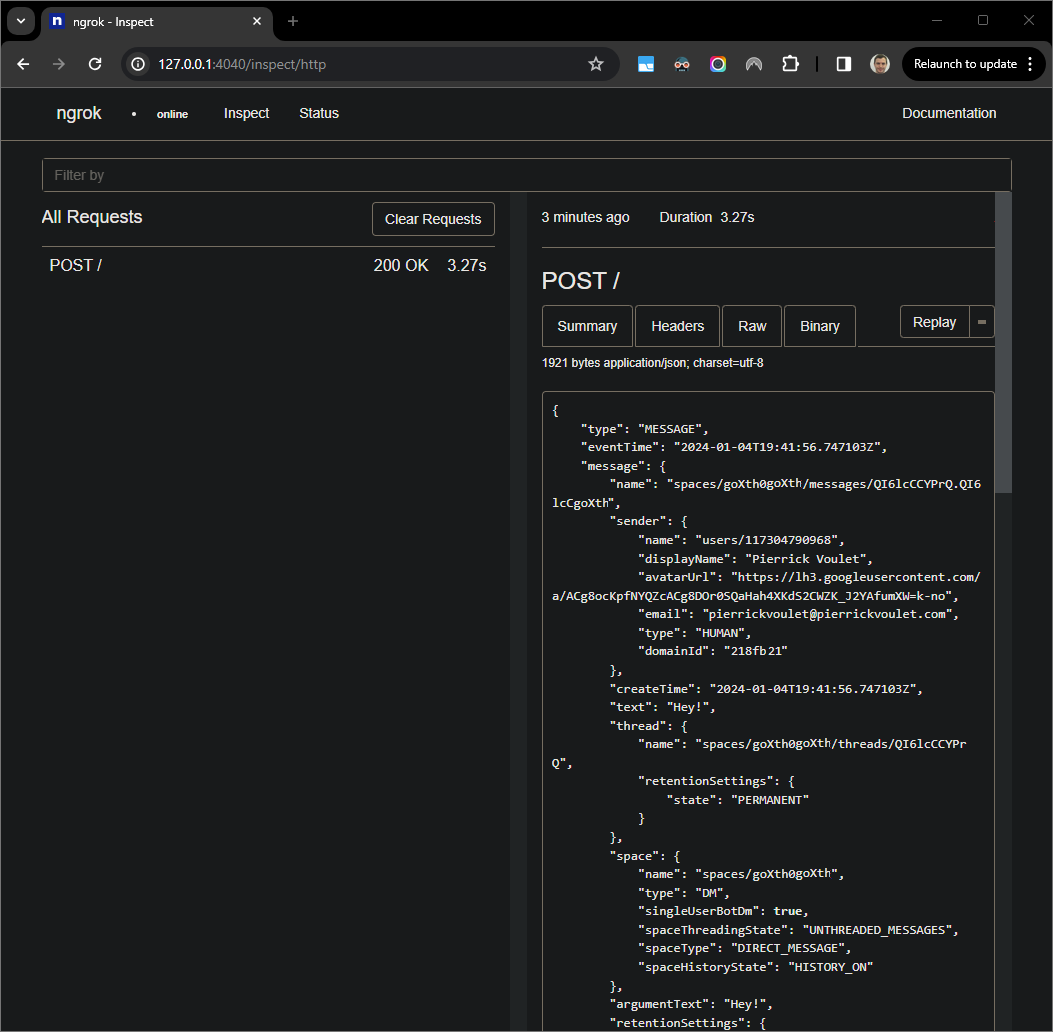
Figure 7. The HTTP request from the web interface hosted by the
ngrokapplication.To change the application behavior, replace
HellowithHeyinline55of theApp.javafile, restart themvnDebugprocess, and relaunchRemote Debug Watchto reattach and restart debugging.This time, instead of sending a second message
Hey!in the space, you can select the last HTTP request logged on the web interface hosted by thengrokapplication in your local environment and clickReplay. Same as last time, your Chat app does not reply because it's being actively debugged.When you resume the execution from the debugger of
Visual Studio Codeyou can see from the web interface hosted by thengrokapplication in your local environment that the application generates a response with the updated version of the message.
Debug from remote environment
In this section, you interact with your Chat app that executes on a remote environment.

Figure 9. Debug from remote environment.
Prerequisites
- A direct message space with your Chat app. You can follow the section Test your Chat app of the Quickstart guide and search for your Chat app to start one.
- Your application running in your remote environment with the debugger
enabled on a given port, it's referenced as
REMOTE_DEBUG_PORTin the instructions of this guide. - Your local environment can
sshto your remote environment. - An IDE set up in your local environment that can debug. We use the
Visual Studio CodeIDE and its default debugging features in this guide for illustration purposes.
Connect your local and remote environments
In your local environment from where you want to initiate a debug client connection, set up an SSH tunnel:
ssh -L LOCAL_DEBUG_PORT:localhost:REMOTE_DEBUG_PORT REMOTE_USERNAME@REMOTE_ADDRESSReplace the following:
LOCAL_DEBUG_PORT: The debug port in your local environment.REMOTE_USERNAME: The username in your remote environment.REMOTE_ADDRESS: The address of your remote environment.REMOTE_DEBUG_PORT: The debug port in your remote environment.
The debug port in your local environment is now linked to the debug port in your remote environment.
Start debugging
From the Visual Studio Code IDE installed in your local environment, do the
following:
- In a new window, open the source code of your app.
Create the file
.vscode/launch.jsonin the root directory and configure a launch namedDebug Remotethat attaches to the debug port in your local environment:Node.js
{
    "version": "0.2.0",
    "configurations": [{
        "type": "node",
        "request": "attach",
        "name": "Debug Remote",
        "address": "127.0.0.1",
        "port": LOCAL_DEBUG_PORT
    }]
}
Python
{
    "version": "0.2.0",
    "configurations": [{
        "type": "python",
        "request": "attach",
        "name": "Debug Remote",
        "connect": {
            "host": "127.0.0.1",
            "port": LOCAL_DEBUG_PORT
        }
    }]
}
Java
{
    "version": "0.2.0",
    "configurations": [{
        "type": "java",
        "request": "attach",
        "name": "Debug Remote",
        "hostName": "127.0.0.1",
        "port": LOCAL_DEBUG_PORT
    }]
}
Replace
LOCAL_DEBUG_PORTwith the debug port in your local environment.Add a breakpoint in the source code of your app that pauses the HTTP request processing, and start running and debugging with the
Debug
Remote
configuration added before.
In the direct message space with your Chat app, type
anything you want to test and press enter. Your
Chat app does not reply because it's being actively
debugged
in the Visual Studio Code IDE.
Related topics
- Learn how to enable and query error logs.
- Learn how to fix Google Chat app errors like "App is not responding", "Google Chat API is only available to Google Workspace users", or "Users can be excluded from spaces".
- Learn how to fix card errors like card messages, dialogs, or link previews not rendering or working as expected.