Page Summary
-
Google Charts can be printed directly from your browser or from JavaScript via the
print()function. -
You can use the
getImageURI()method to get a PNG image of a chart, which works for core charts and geocharts. -
To ensure the chart has finished rendering before calling
getImageURI(), you should wait for thereadyevent. -
The
getImageURI()method requires browser support for the HTML5<canvas>element. -
You can snapshot chart selections, such as tooltips or crosshairs, by calling
setSelection()beforegetImageURI().
Overview
Google Charts can be printed directly from your browser, or from
JavaScript via the print() function. If you want to
provide access to a PNG image of a chart, you can use the
getImageURI() method. This currently works for core
charts
and geocharts.
If your chart (of type ChartType, such as ColumnChart or PieChart) is called my_chart and the div displaying it is my_div, here's how you access the chart as a PNG:
    var my_div = document.getElementById('chart_div');
    var my_chart = new google.visualization.ChartType(chart_div);

    google.visualization.events.addListener(my_chart, 'ready', function () {
      my_div.innerHTML = '<img src="' + my_chart.getImageURI() + '">';
    });

    my_chart.draw(data);
Note: You should wait for
the ready event, as shown in the examples on this page,
to ensure that the chart has finished rendering.
Note: This will only work in browsers that
support the HTML5 <canvas> element, and so won't
work on Internet Explorer 9 or earlier.
Here's a complete example:
<html>
<head>
<script type="text/javascript" src="https://www.gstatic.com/charts/loader.js"></script>
<script type="text/javascript">
google.charts.load("current", {packages:['corechart']});
google.charts.setOnLoadCallback(drawChart);
function drawChart() {
var data = google.visualization.arrayToDataTable([
['Element', 'Density', { role: 'style' }],
['Copper', 8.94, '#b87333', ],
['Silver', 10.49, 'silver'],
['Gold', 19.30, 'gold'],
['Platinum', 21.45, 'color: #e5e4e2' ]
]);
var options = {
title: "Density of Precious Metals, in g/cm^3",
bar: {groupWidth: '95%'},
legend: 'none',
};
var chart_div = document.getElementById('chart_div');
var chart = new google.visualization.ColumnChart(chart_div);
// Wait for the chart to finish drawing before calling the getImageURI() method.
google.visualization.events.addListener(chart, 'ready', function () {
chart_div.innerHTML = '<img src="' + chart.getImageURI() + '">';
console.log(chart_div.innerHTML);
});
chart.draw(data, options);
}
</script>
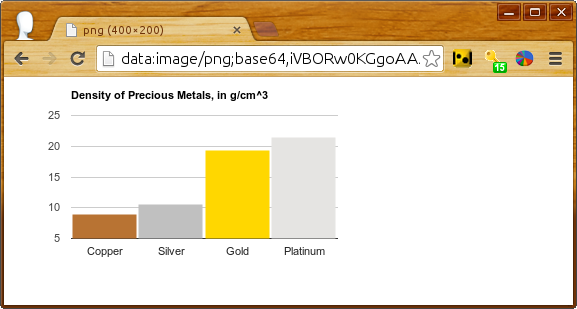
<div id='chart_div'></div>When this program runs, chart_div.innerHTML will be
set to this PNG encoding of the chart and displayed in the JavaScript console:
data:image/png;base64,iVBORw0KGgoAAAANSUhEUgAAAZAAAADICAYAAADGFbfiA...
When that URI is placed directly into a browser address bar, modern browsers will render the image:
You can include a link to the printable version with the following line of JavaScript:
document.getElementById('png').outerHTML = '<a href="' + chart.getImageURI() + '">Printable version</a>';
followed by this line in your HTML:
<div id='png'></div>
Snapshotting Selections
As a chart creator, you can do most anything to your charts
programmatically that users can do in their browsers. So if you want
to create a static image of the chart with
a tooltip
showing or with
crosshairs at a
particular point, you can do that by calling setSelection()
prior to
getImageURI(), as shown below.
Here's a scatter chart with 100 random points, one of them with tooltip and crosshairs pre-selected:
Reload and you'll see a different point selected. The code, with key lines in bold:
<script type="text/javascript">
  google.charts.load("current", {packages:['corechart']});
  google.charts.setOnLoadCallback(drawChart);
  function drawChart() {
    var data = new google.visualization.DataTable();
    data.addColumn('number');
    data.addColumn('number');
    for (var i = 0; i < 100; i++)
      data.addRow([Math.floor(Math.random() * 100),
                   Math.floor(Math.random() * 100)]);

    var options = {
      legend: 'none',
      crosshair: { trigger: 'both' },   // Display crosshairs.
      tooltip: { trigger: 'selection' } // Display tooltips on selection.
    };

    var chart = new google.visualization.ScatterChart(document.getElementById('scatter_setselection'));

    google.visualization.events.addListener(chart, 'ready', function () {
      chart.setSelection([{row:99, column:1}]); // Select one of the points.
      png = '<a href="' + chart.getImageURI() + '">Printable version</a>';
      console.log(png);
    });

    chart.draw(data, options);
  }