Testing your setup
Server-side Tag Manager has a robust preview mode that shows you the event data objects generated by clients, and the inner workings of tags that fire with these events. This is where you get all data relevant to help you debug your setup.
To enter preview mode, click the Preview button in the top right corner in your Tag Manager server container.
When you preview a server container, you will only see requests that originate from the same browser you entered preview mode with, unless you use some advanced configurations.
- Enter preview mode for the server container.
- Load a tab with your modified browser tag to have it dispatch a request to your server container.
- Once the tag has fired, you can switch to the server container Preview window, where you should now see incoming requests.
If you don't see any requests in the server container Preview mode, double-check:
- If your browser tag is using the correct URL to forward requests to the server container.
- If you are loading the page with the browser tag in the same browser where you have the server container Preview window open.
The Preview window in detail
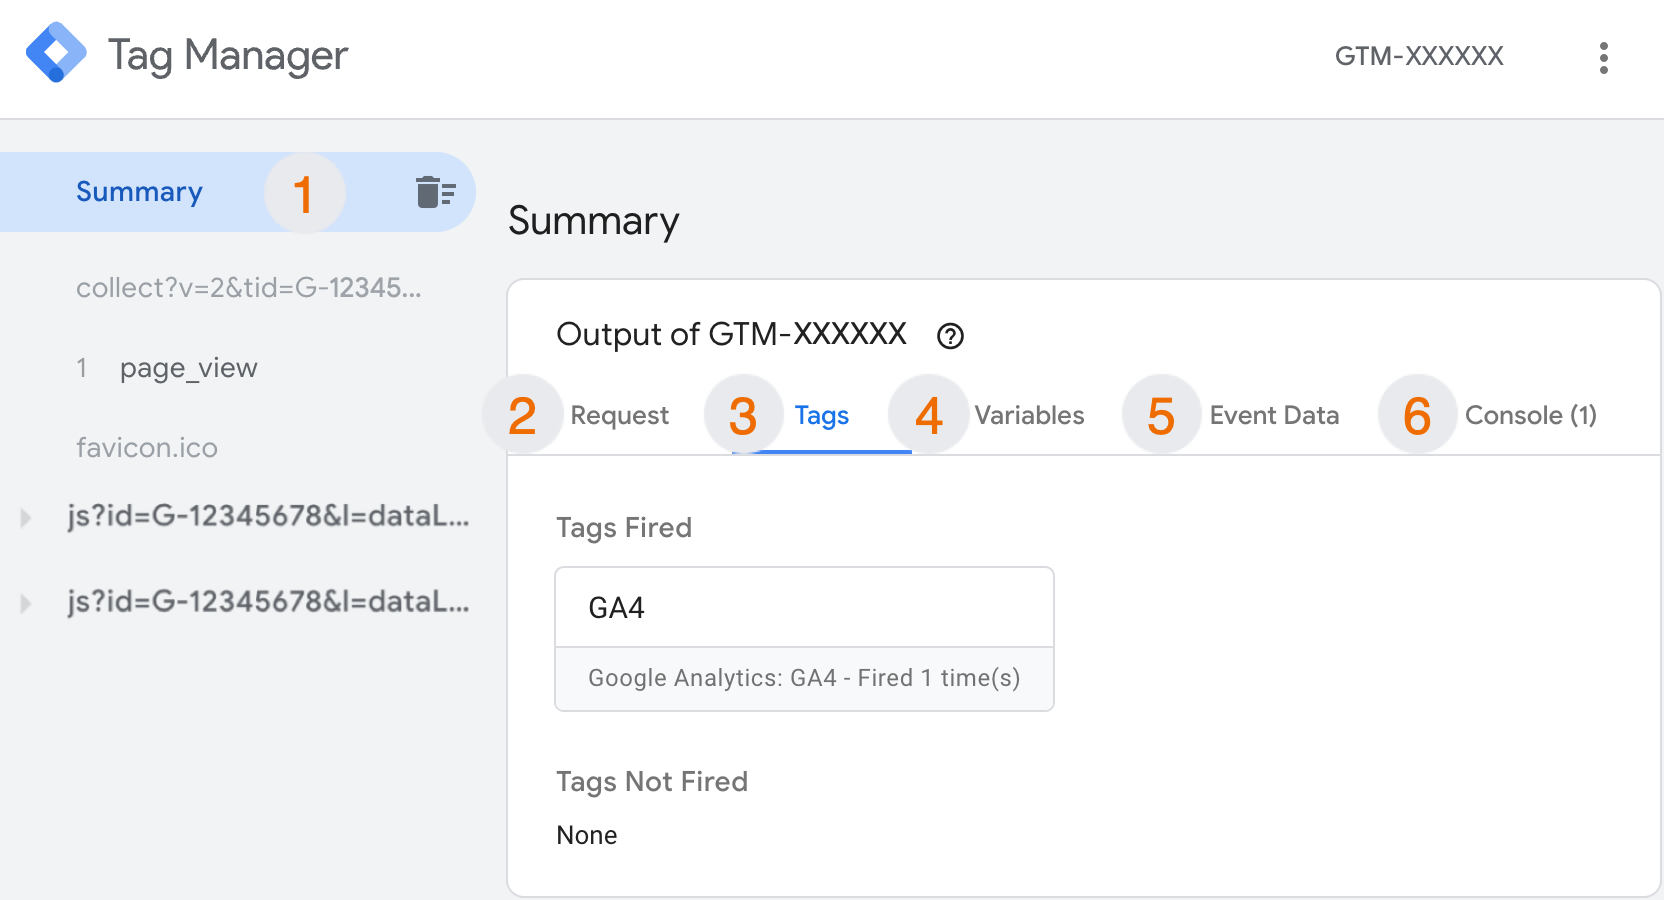
- In the Summary section, you can see a list of all the
incoming requests intercepted by the server container and made available for
Preview mode.
Requests that start withjs?id=G-XXXXXXXXare requests for the Google Tag JavaScript library.
Requests that start withcollect?v=2are Google Analytics requests dispatched by your browser tag. - In the Request tab, you will see the HTTP requests coming in and out of the server and which client claimed them.
- In the Tags tab, you can see which tags fired. In this case, the Google Analytics tag was fired in the server container.
- The Variables tab contains information about all accessible variables sent through the request.
- Event Data shows you the event data object constructed by the client.
- Console shows you useful log messages.
The indented entries in the list are for event data generated by clients. In the screenshot above, the incoming collect?v=2 request generated an event data object for the event name page_view.
With the event (1 page_view) selected, you can click the tabs for Tags, Variables, and Event Data to see how the server container works with the parsed request from the browser.
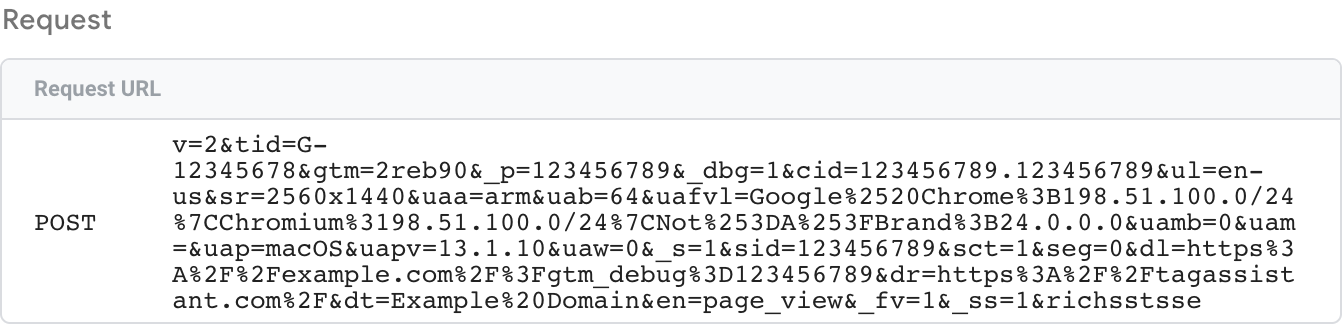
With either the collect?v=2 entry or the page_view event selected, click the Request tab in the Preview mode. You should see an entry in the Outgoing HTTP Requests from Server. This means that your Google Analytics tag successfully forwarded the hit to the Google Analytics servers.
Also, with the event (1 page_view) selected, you can compare the Incoming HTTP Request value (in the Request tab) and the Event Data tab contents to see how the Google Analytics client parsed the incoming HTTP request into the event data object.
Incoming request
What the incoming HTTP request looks like:
Generated Data Object
The client-generated event data object:
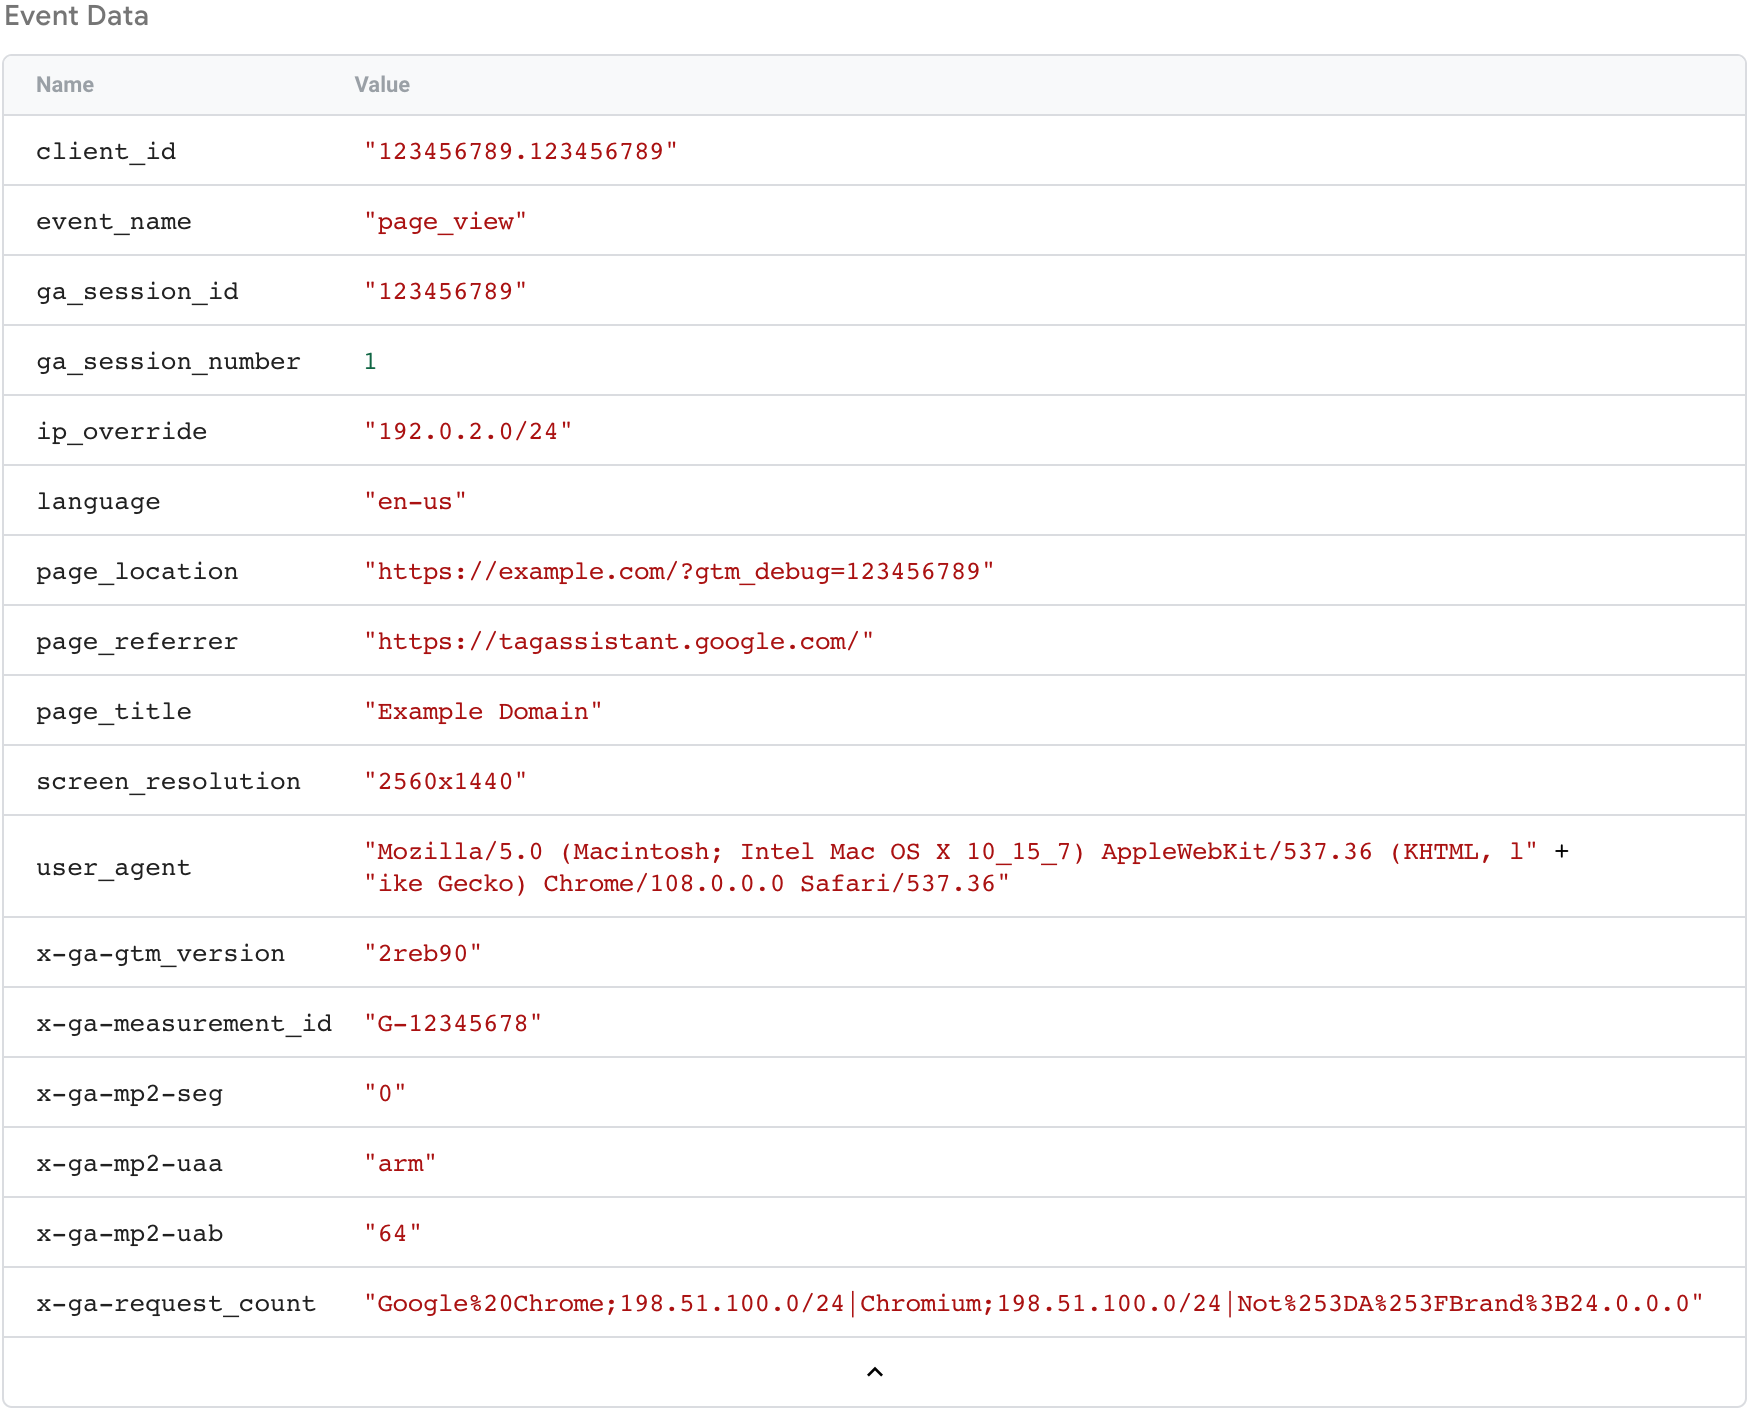
With this event data object, you could add additional tags from different vendors to the server container and have them utilize this information, too.
Once you are happy with this test run, you can Publish the server container and your browser tag(s) to enable this data flow for all your site visitors.
Manual verification with Browser DevTools
In addition to Tag Manager's preview mode, you can verify that your browser is successfully sending requests to your tagging server using your browser's developer tools.
### Verify with browser developer tools To verify that tags are firing on a page: 1. Open your website in Google Chrome. 2. Open Chrome Developer Tools (**View > Developer > Developer Tools**). 3. Open the **Network** tab. 4. Refresh the page. 5. If you see requests to `googletagmanager.com`, your tag is firing. You can further check your setup by looking for hits for specific Google products: * **Google Ads**: Filter for requests to `googleadservices.com` or `googlesyndication.com`. * **Google Analytics**: Filter for requests to `google-analytics.com` or `analytics.google.com`. * **Floodlight**: Filter for requests to `doubleclick.net`. If you don't see requests for a product you configured, it's possible that you only loaded the product with the `config` command but are not sending any events. Check if you are sending events for this product using the `event` command. For example, Google Analytics automatically sends a `page_view` event when the `config` command is called, unless you set `send_page_view` to `false`. If you still don't see any requests, check the Developer Tools **Console** for errors. Note: If you use server-side tagging, check network requests on your tagging server instead of in the browser. For detailed debugging, use [Tag Assistant](vn_Tag_Assistant). [vn_Tag_Assistant]: //tagassistant.google.comWhen looking at the requests in the Network tab, you can verify server-side specific parameters:
- Requests sent to your Server Container URL instead of
google-analytics.com. - Parameters like
v=2for Google Analytics hits. - The
cid(Client ID) matching between the browser and server logs.
Summary
Now you know how requests look like and what data you can expect in your server container.
So far, your tagging server operates in a testing environment. The next chapter introduces the most important considerations before upgrading to a production environment.