
Connected Sheets lets you analyze petabytes of data directly within Google Sheets. You can connect your spreadsheets with a BigQuery data warehouse or Looker and do the analysis by using familiar Sheets tools like pivot tables, charts, and formulas.
Manage a BigQuery data source
This section uses the BigQuery
Shakespeare
public dataset to show how to use Connected Sheets. The dataset
contains the following information:
| Field | Type | Description |
|---|---|---|
| word | STRING |
A single unique word (where whitespace is the delimiter) extracted from a corpus. |
| word_count | INTEGER |
The number of times this word appears in this corpus. |
| corpus | STRING |
The work from which this word was extracted. |
| corpus_date | INTEGER |
The year in which this corpus was published. |
If your application requests any BigQuery Connected Sheets data, it
must provide an OAuth 2.0 token that grants bigquery.readonly scope, in
addition to the other scopes required for a regular Google Sheets API request. For
more information, see Choose Google Sheets API
scopes.
A data source specifies an external location where data is found. The data source is then connected to the spreadsheet.
Add a BigQuery data source
To add a data source, supply an
AddDataSourceRequest
using the
spreadsheets.batchUpdate
method. The request body should specify a dataSource field of type
DataSource
object.
"addDataSource":{
   "dataSource":{
      "spec":{
         "bigQuery":{
            "projectId":"PROJECT_ID",
            "tableSpec":{
               "tableProjectId":"bigquery-public-data",
               "datasetId":"samples",
               "tableId":"shakespeare"
            }
         }
      }
   }
}
Replace PROJECT_ID with a valid Google Cloud project ID.
After a data source is created, an associated
DATA_SOURCE
sheet is created to provide a preview of up to 500 rows. The preview isn't
available immediately. An execution is triggered asynchronously to import the
BigQuery data.
The
AddDataSourceResponse
contains the following fields:
dataSource: The createdDataSourceobject. ThedataSourceIdis a spreadsheet-scoped unique ID. It's populated and referenced to create eachDataSourceobject from the data source.dataExecutionStatus: The status of an execution that imports BigQuery data into the preview sheet. For more information, see the Data execution status section.
Update or delete a BigQuery data source
Use the
spreadsheets.batchUpdate
method and supply an
UpdateDataSourceRequest
or
DeleteDataSourceRequest
request accordingly.
Manage BigQuery data source objects
Once a data source is added to the spreadsheet, a data source object can be created from it. A data source object is a regular Sheets tool such as pivot tables, charts, and formulas that's integrated with Connected Sheets to power your data analysis.
There are four types of objects:
DataSourcetableDataSourcepivotTableDataSourcechartDataSourceformula
Add a BigQuery data source table
Known as an "extract" in the Sheets editor, the table object imports a static dump of data from the data source into Sheets. Similar to a pivot table, the table is specified and anchored to the top left cell.
The following code sample shows how to use the
spreadsheets.batchUpdate
method and an
UpdateCellsRequest
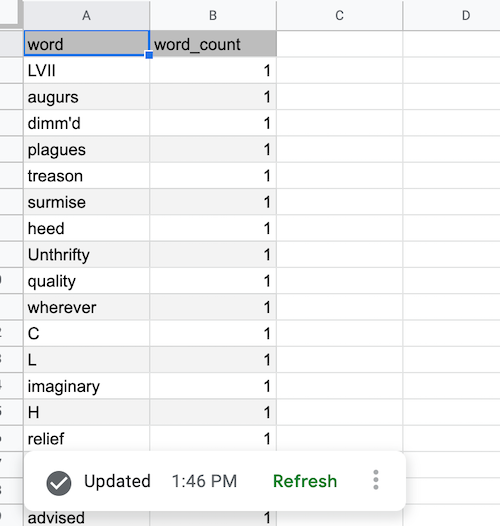
to create a data source table up to 1000 rows of two columns (word and
word_count).
"updateCells":{
   "rows":{
      "values":[
         {
            "dataSourceTable":{
               "dataSourceId":"DATA_SOURCE_ID",
               "columns":[
                  {
                     "name":"word"
                  },
                  {
                     "name":"word_count"
                  }
               ],
               "rowLimit":{
                  "value":1000
               },
               "columnSelectionType":"SELECTED"
            }
         }
      ]
   },
   "fields":"dataSourceTable"
}
Replace DATA_SOURCE_ID with a spreadsheet-scoped unique ID that identifies the data source.
After a data source table is created, the data isn't available immediately. In
the Sheets editor, it's shown as a preview. You need to refresh
the data source table to fetch the BigQuery data. You can specify a
RefreshDataSourceRequest
within the same batchUpdate. Note that all data source objects work similarly.
For more information, see Refresh a data source
object.
After the refresh completes and the BigQuery data is fetched, the data source table is populated as shown:
Add a BigQuery data source pivotTable
Unlike a conventional pivot table, a data source pivot table is backed by a data
source and it references the data by column name. The following code sample
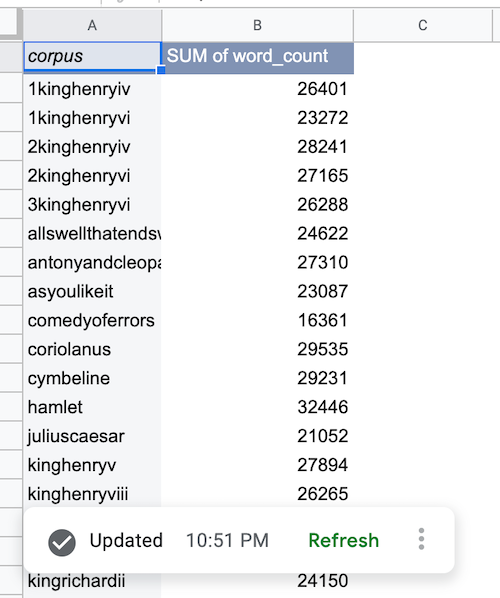
shows how to use the spreadsheets.batchUpdate method and an
UpdateCellsRequest to create a pivot table showing the total word count by
corpus.
"updateCells":{
   "rows":{
      "values":[
         {
            "pivotTable":{
               "dataSourceId":"DATA_SOURCE_ID",
               "rows":{
                  "dataSourceColumnReference":{
                     "name":"corpus"
                  },
                  "sortOrder":"ASCENDING"
               },
               "values":{
                  "summarizeFunction":"SUM",
                  "dataSourceColumnReference":{
                     "name":"word_count"
                  }
               }
            }
         }
      ]
   },
   "fields":"pivotTable"
    }
Replace DATA_SOURCE_ID with a spreadsheet-scoped unique ID that identifies the data source.
After BigQuery data is fetched, the data source pivot table is populated as shown:
Add a BigQuery data source chart
The following code sample shows how to use the spreadsheets.batchUpdate method
and an
AddChartRequest
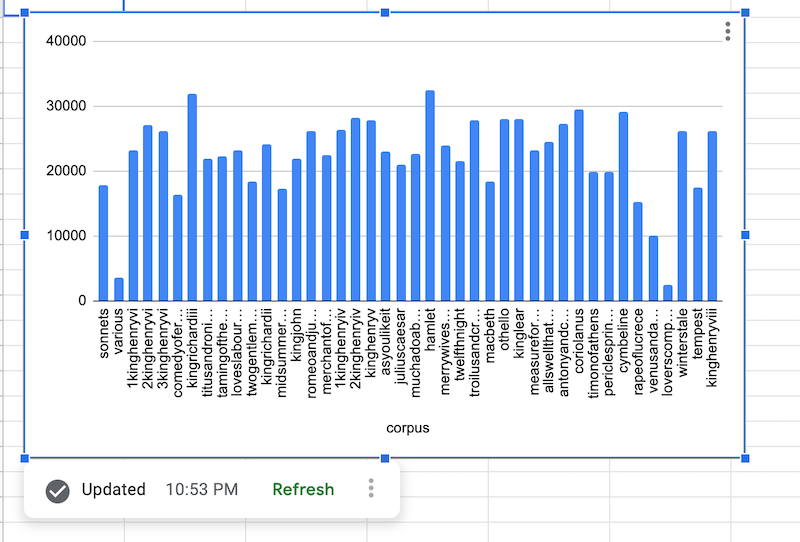
to create a data source chart with a chartType of COLUMN, showing the total
word count by corpus.
"addChart":{
   "chart":{
      "spec":{
         "title":"Corpus by word count",
         "basicChart":{
            "chartType":"COLUMN",
            "domains":[
               {
                  "domain":{
                     "columnReference":{
                        "name":"corpus"
                     }
                  }
               }
            ],
            "series":[
               {
                  "series":{
                     "columnReference":{
                        "name":"word_count"
                     },
                     "aggregateType":"SUM"
                  }
               }
            ]
         }
      },
      "dataSourceChartProperties":{
         "dataSourceId":"DATA_SOURCE_ID"
      }
   }
}
Replace DATA_SOURCE_ID with a spreadsheet-scoped unique ID that identifies the data source.
After BigQuery data is fetched, the data source chart is rendered as shown:
Add a BigQuery data source formula
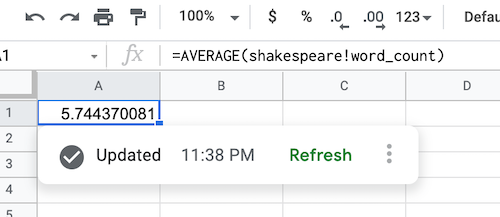
The following code sample shows how to use the spreadsheets.batchUpdate method
and an UpdateCellsRequest to create a data source formula to compute the
average word count.
"updateCells":{
   "rows":[
      {
         "values":[
            {
               "userEnteredValue":{
                  "formulaValue":"=AVERAGE(shakespeare!word_count)"
               }
            }
         ]
      }
   ],
   "fields":"userEnteredValue"
}
After BigQuery data is fetched, the data source formula is populated as shown:
Refresh a BigQuery data source object
You can refresh a data source object to fetch the latest data from BigQuery
based on the current data source specs and object configurations. You can use
the
spreadsheets.batchUpdate
method to call the
RefreshDataSourceRequest.
Then specify one or more object references to refresh using the
DataSourceObjectReferences
object.
Note that you can both create and refresh data source objects within a single
batchUpdate request.
Manage a Looker data source
This guide will show how to add a Looker data source, update or delete it, create a pivot table on it and refresh it.
Your application requesting any Looker Connected Sheets data, will reuse your existing Google Account Link with Looker.
Add a Looker data source
To add a data source, supply an
AddDataSourceRequest
using the
spreadsheets.batchUpdate
method. The request body should specify a dataSource field of type
DataSource
object.
"addDataSource":{
   "dataSource":{
      "spec":{
         "looker":{
            "instance_uri":"INSTANCE_URI",
            "model":"MODEL",
            "explore":"EXPLORE"
         }
      }
   }
}
Replace INSTANCE_URI, MODEL and EXPLORE with a valid Looker instance URI, model name and explore name respectively.
After a data source is created, an associated
DATA_SOURCE
sheet is created to provide a preview of the structure of the selected Explore,
including views, dimensions, measures, and any field descriptions.
The
AddDataSourceResponse
contains the following fields:
dataSource: The createdDataSourceobject. ThedataSourceIdis a spreadsheet-scoped unique ID. It's populated and referenced to create eachDataSourceobject from the data source.dataExecutionStatus: The status of an execution that imports BigQuery data into the preview sheet. For more information, see the Data execution status section.
Update or delete a Looker data source
Use the
spreadsheets.batchUpdate
method and supply an
UpdateDataSourceRequest
or
DeleteDataSourceRequest
request accordingly.
Manage Looker data source objects
Once a data source is added to the spreadsheet, a data source object can be
created from it. For Looker data sources, you can only create a DataSource
pivotTable object from it.
It is not possible to create DataSource formulas, extracts, and charts from
Looker data sources.
Refresh a Looker data source object
You can refresh a data source object to fetch the latest data from Looker
based on the current data source specs and object configurations. You can use
the
spreadsheets.batchUpdate
method to call the
RefreshDataSourceRequest.
Then specify one or more object references to refresh using the
DataSourceObjectReferences
object.
Note that you can both create and refresh data source objects within a single
batchUpdate request.
Data execution status
When you create data sources or refresh data source objects, a background
execution is created to fetch the data from BigQuery or Looker and return a
response containing the
DataExecutionStatus.
If the execution starts successfully, the
DataExecutionState
is usually in the RUNNING state.
Because the process is asynchronous, your application should implement a polling
model to periodically retrieve the status for the data source objects. Use the
spreadsheets.get
method until the status returns either the SUCCEEDED or FAILED state.
Execution completes quickly in most cases, but it depends on the complexity of
your data source. Usually the execution doesn't exceed 10 minutes.
Related topics
- Choose Google Sheets API scopes
- Get started with BigQuery data in Google Sheets
- BigQuery documentation
- BigQuery: Using Connected Sheets
- Connected Sheets video tutorial
- Using Connected Sheets for Looker
- Looker Introduction