
Penting: Paket Premium Google Maps Platform tidak lagi tersedia untuk pendaftar atau pelanggan baru.
Selamat datang di Premium Plan Google Maps Platform
Setelah mendaftar ke Premium Plan Google Maps Platform, Anda akan menerima email selamat datang dari Google di alamat email kontak yang Anda berikan. Email selamat datang Anda berisi informasi yang Anda butuhkan untuk memulai:
- ID Project
- Client ID
- Rahasia penandatanganan URL atau kunci kriptografis pribadi, untuk client ID Anda
- Akun Google
Yang disertakan dalam paket Anda
Premium Plan Anda memberi akses ke rangkaian layanan dan dokumentasi kami untuk setiap API, termasuk panduan developer dan referensi API.
| Web API | Web Service API | Mobile SDK |
|---|---|---|
1 Places API tidak disertakan dalam Lisensi Pelacakan Aset Premium Plan. Jika Anda memiliki Lisensi Asset Tracking, dan ingin menggunakan Places API, hubungi tim Penjualan Google Maps API.
Penyediaan API
Semua API yang Anda beli di project Konsol Google Cloud telah diaktifkan. Untuk mengakses API, login dengan Akun Google, lalu pilih ID project Anda, yang dimulai dengan Google Maps APIs for Business atau Google Maps for Work atau Google Maps. Akun dan project ID Anda ada di email selamat datang.
Autentikasi dan otorisasi
Untuk membuat permintaan ke API, Anda harus mengautentikasi aplikasi Anda dengan kunci API atau client ID Anda. Selain itu, permintaan untuk beberapa API juga memerlukan tanda tangan digital.
Kunci API
Anda dapat menggunakan kunci API untuk mengautentikasi permintaan ke API mana saja. Untuk membuat kunci, gunakan project Konsol Cloud yang dikaitkan dengan project ID Anda. Dengan menggunakan kunci API, Anda dapat:
Mengelola semua API Anda di Konsol Cloud
Mengakses data penggunaan real-time dan data penggunaan historis 30 hari untuk aplikasi Anda di Konsol Cloud Google Maps Platform Metrics
ID Klien
Daripada kunci API, gunakan client ID untuk membuat permintaan ke salah satu API kecuali API berikut: Places API, Geolocation API, Roads API, Maps SDK for Android, dan Maps SDK for iOS.
Dengan client ID, Anda dapat:
Mengelola Client ID dan mengakses rahasia penandatanganan URL atau kunci kriptografis pribadi Anda, di Konsol Cloud.
Mengakses data penggunaan real-time dan data penggunaan historis 30 hari untuk aplikasi Anda dari halaman Metrik Konsol Cloud.
Untuk client ID, label format berikut akan digunakan:
project_number:<YOUR_PROJECT_NUMBER>.Menambahkan parameter
channelke permintaan sehingga Anda dapat melihat laporan penggunaan yang lebih detail.
Tempat mengelola Client ID Anda di konsol Google Cloud
Fungsi pengelolaan Client ID Paket Premium tersedia di Konsol Cloud di bagian bawah halaman Kredensial Google Maps Platform, di bagian Client ID.
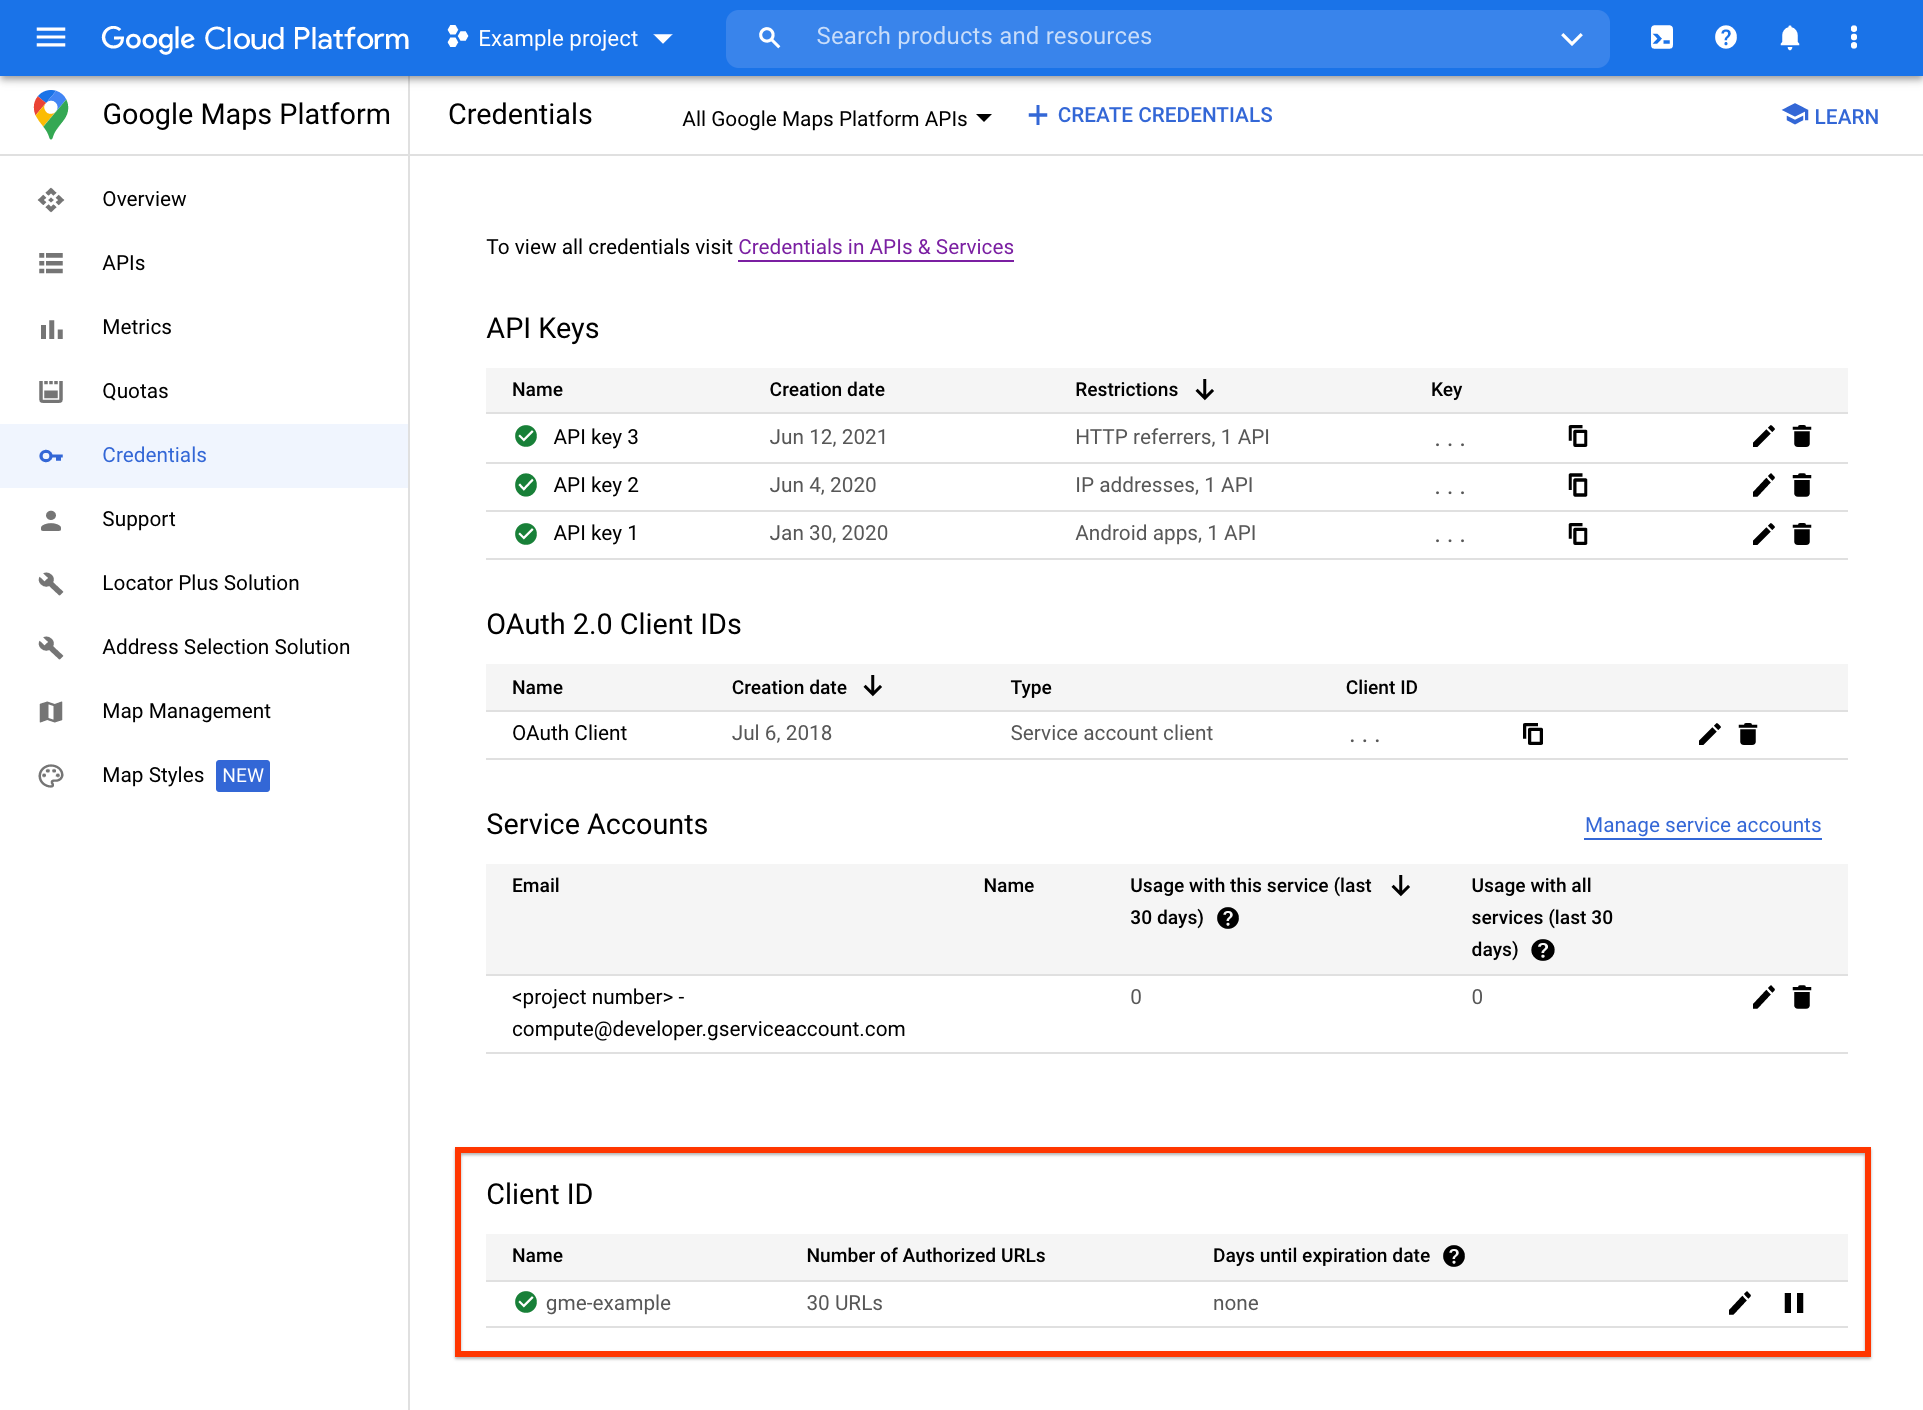
Tugas pengelolaan client ID lebih lanjut, termasuk otorisasi URL dan pengelolaan rahasia penandatanganan client ID, dapat diakses di halaman Client ID terpisah, dengan mengklik ikon edit di ujung kanan bagian Client ID.
Tanda tangan digital
Selain kunci API atau client ID, permintaan ke beberapa API juga memerlukan tanda tangan digital unik agar dapat mengakses kuota dan fitur Paket Premium. Anda dapat membuat tanda tangan digital menggunakan rahasia penandatanganan URL atau kunci kriptografis pribadi, yang disertakan dalam Email selamat datang (dan tersedia di Konsol Cloud). Tanda tangan digital diperlukan, terutama jika Anda menggunakan:
Client ID dengan Web Service API, Maps Static API, atau Street View Static API
Kunci API dengan Maps Static API atau Street View Static API
Untuk informasi selengkapnya
Untuk petunjuk mendetail tentang penggunaan kunci API atau client ID dan cara membuat tanda tangan digital, lihat Ringkasan Autentikasi Paket Premium.
FAQ
Jika Anda memiliki pertanyaan tentang Google Maps Platform, lihat pertanyaan umum (FAQ):
Mendapatkan bantuan
Sebagai pelanggan Premium Plan Google Maps Platform, Anda dapat mengakses Konsol Cloud, tempat Anda dapat menemukan informasi kontak dukungan dan mengakses alat serta referensi eksklusif. Untuk mengetahui detailnya, lihat Dukungan dan Referensi Google Maps Platform.