- مالك الكتالوج
- Awesome GEE Community Catalog
- مدى توفّر مجموعة البيانات
- 2000-01-04T00:00:00Z–2026-05-26T00:00:00Z
- الجهة المنتجة لمجموعة البيانات
- المركز الوطني للحدّ من آثار الجفاف
- العلامات
الوصف
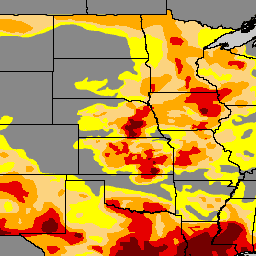
إنّ "مؤشر الجفاف في الولايات المتحدة" عبارة عن خريطة يتم إصدارها كل خميس، وتعرض أجزاء من الولايات المتحدة التي تعاني من الجفاف. تستخدم الخريطة خمسة تصنيفات: جفاف غير طبيعي (D0)، وتعرض المناطق التي قد تكون في حالة جفاف أو تخرج منها، وأربعة مستويات من الجفاف: معتدل (D1) وشديد (D2) وقاسٍ (D3) واستثنائي (D4). لقد كان "مؤشر الجفاف" جهدًا جماعيًا منذ إنشائه في عام 1999، وقد تم إنتاجه بشكل مشترك من قِبل "المركز الوطني لتخفيف آثار الجفاف" (NDMC) في جامعة نبراسكا-لينكولن، و"الإدارة الوطنية للمحيطات والغلاف الجوي" (NOAA)، و"وزارة الزراعة الأمريكية" (USDA). يستضيف "المركز الوطني لتخفيف آثار الجفاف" الموقع الإلكتروني الخاص بمؤشر الجفاف والبيانات المرتبطة به، ويقدّم الخريطة والبيانات إلى "الإدارة الوطنية للمحيطات والغلاف الجوي" و"وزارة الزراعة الأمريكية" والوكالات الأخرى. ويمكن الوصول إليه مجانًا على droughtmonitor.unl.edu.
النطاقات
النطاقات
حجم البكسل: 250 مترًا (جميع النطاقات)
| الاسم | الحد الأدنى | الحد الأقصى | حجم البكسل | الوصف |
|---|---|---|---|---|
DM |
0 | 4 | 250 مترًا | فئات الجفاف |
بنود الاستخدام
بنود الاستخدام
العمل مرخّص بموجب ترخيص بيانات مفتوحة للاستخدام. يتم إعداد "مؤشر الجفاف في الولايات المتحدة" بشكل مشترك من قِبل "المركز الوطني للحد من الجفاف" في "جامعة نبراسكا-لينكولن" ووزارة الزراعة الأمريكية و"الإدارة الوطنية للمحيطات والغلاف الجوي". الخريطة مقدَّمة من NDMC.
الاقتباسات
National Drought Mitigation Center; U.S. Department of Agriculture; National Oceanic and Atmospheric Administration (2023). United States Drought Monitor. University of Nebraska-Lincoln. https://droughtmonitor.unl.edu/. تم الوصول إليه في 2023-09-17
الاستكشاف باستخدام Earth Engine
أداة تعديل الرموز (JavaScript)
var usdm = ee.ImageCollection(
  "projects/sat-io/open-datasets/us-drought-monitor"
);
/*
Category	Description
DO	Abnormally Dry
D1	Moderate Drought
D2	Severe Drought
D3	Extreme Drought
D4	Exceptional Drought
*/

var usdm = ee.Image(usdm.toList(usdm.size()).get(-1));

// Define a dictionary which will be used to make legend and visualize image on map
var dict = {
  names: [
    "DO	Abnormally Dry", //1
    "D1 Moderate Drought", //2
    "D2 Severe Drought", //3
    "D3 Extreme Drought", //4
    "D4 Exceptional Drought", //5
  ],
  colors: ["FFFF00", "FCD37F", "FFAA00", "E60000", "730000"],
};

// Create a panel to hold the legend widget
var legend = ui.Panel({
  style: {
    position: "bottom-left",
    padding: "8px 15px",
  },
});

// Function to generate the legend
function addCategoricalLegend(panel, dict, title) {
  // Create and add the legend title.
  var legendTitle = ui.Label({
    value: title,
    style: {
      fontWeight: "bold",
      fontSize: "18px",
      margin: "0 0 4px 0",
      padding: "0",
    },
  });
  panel.add(legendTitle);

  var loading = ui.Label("Loading legend...", { margin: "2px 0 4px 0" });
  panel.add(loading);

  // Creates and styles 1 row of the legend.
  var makeRow = function (color, name) {
    // Create the label that is actually the colored box.
    var colorBox = ui.Label({
      style: {
        backgroundColor: color,
        // Use padding to give the box height and width.
        padding: "8px",
        margin: "0 0 4px 0",
      },
    });

    // Create the label filled with the description text.
    var description = ui.Label({
      value: name,
      style: { margin: "0 0 4px 6px" },
    });

    return ui.Panel({
      widgets: [colorBox, description],
      layout: ui.Panel.Layout.Flow("horizontal"),
    });
  };

  // Get the list of palette colors and class names from the image.
  var palette = dict["colors"];
  var names = dict["names"];
  loading.style().set("shown", false);

  for (var i = 0; i < names.length; i++) {
    panel.add(makeRow(palette[i], names[i]));
  }

  Map.add(panel);
}

/*
  // Display map and legend ///////////////////////////////////////////////////////////////////////////////
*/

// Add the legend to the map
addCategoricalLegend(legend, dict, "US Drought Monitor");

// Add USDM Image image to the map
Map.addLayer(
  usdm,
  { min: 0, max: 4, palette: dict["colors"] },
  usdm.get("system:index").getInfo()
);