- Kataloginhaber
- Awesome GEE Community Catalog
- Dataset-Verfügbarkeit
- 2000-01-04T00:00:00Z–2026-06-02T00:00:00Z
- Ersteller des Datasets
- National Drought Mitigation Center
- Tags
Beschreibung
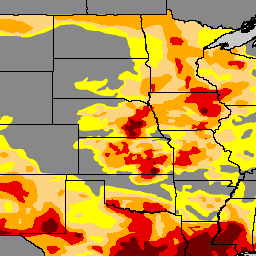
Der U.S. Drought Monitor ist eine Karte, die jeden Donnerstag veröffentlicht wird und die Teile der USA zeigt, die von Dürre betroffen sind. Auf der Karte werden fünf Klassifizierungen verwendet: „ungewöhnlich trocken“ (D0) für Gebiete, die möglicherweise in eine Dürre eintreten oder aus einer Dürre kommen, und vier Dürregrade: „mäßig“ (D1), „schwer“ (D2), „extrem“ (D3) und „außergewöhnlich“ (D4). Der Drought Monitor ist seit seiner Einführung im Jahr 1999 ein Gemeinschaftsprojekt des National Drought Mitigation Center (NDMC) an der University of Nebraska-Lincoln, der National Oceanic and Atmospheric Administration (NOAA) und des US Department of Agriculture (USDA). Das NDMC hostet die Website des Dürremonitors und die zugehörigen Daten und stellt die Karte und die Daten der NOAA, dem USDA und anderen Behörden zur Verfügung. Es ist unter droughtmonitor.unl.edu frei verfügbar.
Bänder
Bänder
Pixelgröße: 250 Meter (alle Bänder)
| Name | Min. | Max. | Pixelgröße | Beschreibung |
|---|---|---|---|---|
DM |
0 | 4 | 250 Meter | Dürreklassen |
Nutzungsbedingungen
Nutzungsbedingungen
Die Arbeit ist unter einer Open-Data-Lizenz zur Nutzung lizenziert. Der U.S. Drought Monitor wird gemeinsam vom National Drought Mitigation Center an der University of Nebraska-Lincoln, dem Landwirtschaftsministerium der Vereinigten Staaten und der National Oceanic and Atmospheric Administration erstellt. Karte mit freundlicher Genehmigung des NDMC.
Zitationen
National Drought Mitigation Center; U.S. Department of Agriculture; National Oceanic and Atmospheric Administration (2023). United States Drought Monitor. University of Nebraska-Lincoln. https://droughtmonitor.unl.edu/. Zugriff am 17.09.2023
Die Earth Engine nutzen
Code-Editor (JavaScript)
var usdm = ee.ImageCollection(
  "projects/sat-io/open-datasets/us-drought-monitor"
);
/*
Category	Description
DO	Abnormally Dry
D1	Moderate Drought
D2	Severe Drought
D3	Extreme Drought
D4	Exceptional Drought
*/

var usdm = ee.Image(usdm.toList(usdm.size()).get(-1));

// Define a dictionary which will be used to make legend and visualize image on map
var dict = {
  names: [
    "DO	Abnormally Dry", //1
    "D1 Moderate Drought", //2
    "D2 Severe Drought", //3
    "D3 Extreme Drought", //4
    "D4 Exceptional Drought", //5
  ],
  colors: ["FFFF00", "FCD37F", "FFAA00", "E60000", "730000"],
};

// Create a panel to hold the legend widget
var legend = ui.Panel({
  style: {
    position: "bottom-left",
    padding: "8px 15px",
  },
});

// Function to generate the legend
function addCategoricalLegend(panel, dict, title) {
  // Create and add the legend title.
  var legendTitle = ui.Label({
    value: title,
    style: {
      fontWeight: "bold",
      fontSize: "18px",
      margin: "0 0 4px 0",
      padding: "0",
    },
  });
  panel.add(legendTitle);

  var loading = ui.Label("Loading legend...", { margin: "2px 0 4px 0" });
  panel.add(loading);

  // Creates and styles 1 row of the legend.
  var makeRow = function (color, name) {
    // Create the label that is actually the colored box.
    var colorBox = ui.Label({
      style: {
        backgroundColor: color,
        // Use padding to give the box height and width.
        padding: "8px",
        margin: "0 0 4px 0",
      },
    });

    // Create the label filled with the description text.
    var description = ui.Label({
      value: name,
      style: { margin: "0 0 4px 6px" },
    });

    return ui.Panel({
      widgets: [colorBox, description],
      layout: ui.Panel.Layout.Flow("horizontal"),
    });
  };

  // Get the list of palette colors and class names from the image.
  var palette = dict["colors"];
  var names = dict["names"];
  loading.style().set("shown", false);

  for (var i = 0; i < names.length; i++) {
    panel.add(makeRow(palette[i], names[i]));
  }

  Map.add(panel);
}

/*
  // Display map and legend ///////////////////////////////////////////////////////////////////////////////
*/

// Add the legend to the map
addCategoricalLegend(legend, dict, "US Drought Monitor");

// Add USDM Image image to the map
Map.addLayer(
  usdm,
  { min: 0, max: 4, palette: dict["colors"] },
  usdm.get("system:index").getInfo()
);