- 카탈로그 소유자
- Awesome GEE Community Catalog
- 데이터 세트 제공
- 2000-01-04T00:00:00Z–2026-06-02T00:00:00Z
- 데이터 세트 출처
- National Drought Mitigation Center
- 태그
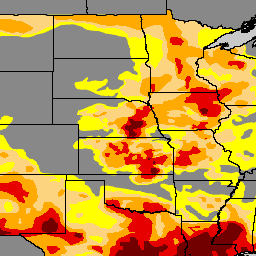
설명
미국 가뭄 모니터는 매주 목요일에 발표되는 지도로, 가뭄이 발생한 미국 지역을 보여줍니다. 지도에는 비정상적으로 건조한 지역(D0)과 가뭄이 시작되거나 끝나는 지역을 나타내는 5가지 분류와 4단계의 가뭄(보통(D1), 심각(D2), 극심(D3), 매우 심각(D4))이 사용됩니다. 가뭄 모니터는 1999년 시작된 이후로 네브래스카-링컨 대학교의 국립 가뭄 완화 센터 (NDMC), 국립해양대기청 (NOAA), 미국 농무부 (USDA)가 공동으로 제작한 팀 노력의 결과입니다. NDMC는 가뭄 모니터 웹사이트와 관련 데이터를 호스팅하고 NOAA, USDA 및 기타 기관에 지도와 데이터를 제공합니다. droughtmonitor.unl.edu에서 무료로 이용할 수 있습니다.
대역
대역
픽셀 크기: 250m (모든 밴드)
| 이름 | 최소 | 최대 | 픽셀 크기 | 설명 |
|---|---|---|---|---|
DM |
0 | 4 | 250미터 | 가뭄 클래스 |
이용약관
이용약관
이 저작물은 사용을 위한 오픈 데이터 라이선스에 따라 라이선스가 부여됩니다. 미국 가뭄 모니터는 네브래스카-링컨 대학교의 국립 가뭄 완화 센터, 미국 농무부, 국립해양대기청이 공동으로 제작합니다. 지도 출처: NDMC
인용
National Drought Mitigation Center; U.S. Department of Agriculture; National Oceanic and Atmospheric Administration (2023). United States Drought Monitor. University of Nebraska-Lincoln. https://droughtmonitor.unl.edu/. 2023년 9월 17일 액세스
Earth Engine으로 탐색
코드 편집기(JavaScript)
var usdm = ee.ImageCollection(
  "projects/sat-io/open-datasets/us-drought-monitor"
);
/*
Category	Description
DO	Abnormally Dry
D1	Moderate Drought
D2	Severe Drought
D3	Extreme Drought
D4	Exceptional Drought
*/

var usdm = ee.Image(usdm.toList(usdm.size()).get(-1));

// Define a dictionary which will be used to make legend and visualize image on map
var dict = {
  names: [
    "DO	Abnormally Dry", //1
    "D1 Moderate Drought", //2
    "D2 Severe Drought", //3
    "D3 Extreme Drought", //4
    "D4 Exceptional Drought", //5
  ],
  colors: ["FFFF00", "FCD37F", "FFAA00", "E60000", "730000"],
};

// Create a panel to hold the legend widget
var legend = ui.Panel({
  style: {
    position: "bottom-left",
    padding: "8px 15px",
  },
});

// Function to generate the legend
function addCategoricalLegend(panel, dict, title) {
  // Create and add the legend title.
  var legendTitle = ui.Label({
    value: title,
    style: {
      fontWeight: "bold",
      fontSize: "18px",
      margin: "0 0 4px 0",
      padding: "0",
    },
  });
  panel.add(legendTitle);

  var loading = ui.Label("Loading legend...", { margin: "2px 0 4px 0" });
  panel.add(loading);

  // Creates and styles 1 row of the legend.
  var makeRow = function (color, name) {
    // Create the label that is actually the colored box.
    var colorBox = ui.Label({
      style: {
        backgroundColor: color,
        // Use padding to give the box height and width.
        padding: "8px",
        margin: "0 0 4px 0",
      },
    });

    // Create the label filled with the description text.
    var description = ui.Label({
      value: name,
      style: { margin: "0 0 4px 6px" },
    });

    return ui.Panel({
      widgets: [colorBox, description],
      layout: ui.Panel.Layout.Flow("horizontal"),
    });
  };

  // Get the list of palette colors and class names from the image.
  var palette = dict["colors"];
  var names = dict["names"];
  loading.style().set("shown", false);

  for (var i = 0; i < names.length; i++) {
    panel.add(makeRow(palette[i], names[i]));
  }

  Map.add(panel);
}

/*
  // Display map and legend ///////////////////////////////////////////////////////////////////////////////
*/

// Add the legend to the map
addCategoricalLegend(legend, dict, "US Drought Monitor");

// Add USDM Image image to the map
Map.addLayer(
  usdm,
  { min: 0, max: 4, palette: dict["colors"] },
  usdm.get("system:index").getInfo()
);