- ক্যাটালগ মালিক
- অসাধারণ GEE কমিউনিটি ক্যাটালগ
- ডেটাসেটের প্রাপ্যতা
- 2000-01-01T00:00:00Z–2023-12-31T00:00:00Z
- ডেটাসেট প্রযোজক
- ওক রিজ জাতীয় পরীক্ষাগার
- ট্যাগ
বর্ণনা
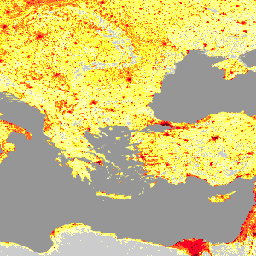
ওক রিজ ন্যাশনাল ল্যাবরেটরি (ORNL) কর্তৃক প্রদত্ত ল্যান্ডস্ক্যান ডেটাসেটটি একটি ব্যাপক ও উচ্চ-রেজোলিউশনের বৈশ্বিক জনসংখ্যা বন্টন ডেটাসেট, যা বিভিন্ন ধরনের প্রয়োগের জন্য একটি মূল্যবান সম্পদ হিসেবে কাজ করে। অত্যাধুনিক স্থানিক মডেলিং কৌশল এবং উন্নত ভূ-স্থানিক ডেটা উৎস ব্যবহার করে, ল্যান্ডস্ক্যান ৩০ আর্ক-সেকেন্ড রেজোলিউশনে জনসংখ্যা গণনা ও ঘনত্বের উপর বিস্তারিত তথ্য প্রদান করে, যা বিশ্বজুড়ে মানব বসতি বিন্যাস সম্পর্কে নির্ভুল এবং হালনাগাদ ধারণা দেয়। এর নির্ভুলতা এবং সূক্ষ্মতার কারণে, ল্যান্ডস্ক্যান নগর পরিকল্পনা, দুর্যোগ মোকাবেলা, মহামারীবিদ্যা এবং পরিবেশগত গবেষণার মতো বিভিন্ন ক্ষেত্রে সহায়তা করে, যা এটিকে বিশ্বব্যাপী বিভিন্ন সামাজিক ও পরিবেশগত চ্যালেঞ্জ বোঝা এবং মোকাবেলা করতে আগ্রহী নীতি নির্ধারক ও গবেষকদের জন্য একটি অপরিহার্য হাতিয়ারে পরিণত করে।
ব্যান্ড
ব্যান্ড
পিক্সেল সাইজ: ১০০০ মিটার (সকল ব্যান্ড)
| নাম | মিনিট | ম্যাক্স | পিক্সেল আকার | বর্ণনা |
|---|---|---|---|---|
b1 | ০* | ২১১৭১* | ১০০০ মিটার | আনুমানিক জনসংখ্যা গণনা |
ব্যবহারের শর্তাবলী
ব্যবহারের শর্তাবলী
ল্যান্ডস্ক্যান ডেটাসেটগুলো ক্রিয়েটিভ কমন্স অ্যাট্রিবিউশন ৪.০ ইন্টারন্যাশনাল লাইসেন্সের অধীনে লাইসেন্সপ্রাপ্ত। ব্যবহারকারীরা বাণিজ্যিক এবং অবাণিজ্যিক উদ্দেশ্যে কোনো বিধিনিষেধ ছাড়াই কাজটি ব্যবহার, অনুলিপি, বিতরণ, প্রেরণ এবং অভিযোজন করতে পারেন, যতক্ষণ পর্যন্ত উৎসের স্পষ্ট স্বীকৃতি প্রদান করা হয়।
উদ্ধৃতি
সিমস, কে., রেইথ, এ., ব্রাইট, ই., কফম্যান, জে., পাইল, জে., এপটিং, জে., গঞ্জালেস, জে., অ্যাডামস, ডি., পাওয়েল, ই., আরবান, এম., ও রোজ, এ. (২০২৩)। ল্যান্ডস্ক্যান গ্লোবাল ২০২২ [ডেটা সেট]। ওক রিজ ন্যাশনাল ল্যাবরেটরি। https://doi.org/10.48690/1529167
DOI
আর্থ ইঞ্জিন দিয়ে অন্বেষণ করুন
কোড এডিটর (জাভাস্ক্রিপ্ট)
var landscan_global =
    ee.ImageCollection('projects/sat-io/open-datasets/ORNL/LANDSCAN_GLOBAL');
var popcount_intervals = '<RasterSymbolizer>' +
    ' <ColorMap type="intervals" extended="false" >' +
    '<ColorMapEntry color="#CCCCCC" quantity="0" label="No Data"/>' +
    '<ColorMapEntry color="#FFFFBE" quantity="5" label="Population Count (Estimate)"/>' +
    '<ColorMapEntry color="#FEFF73" quantity="25" label="Population Count (Estimate)"/>' +
    '<ColorMapEntry color="#FEFF2C" quantity="50" label="Population Count (Estimate)"/>' +
    '<ColorMapEntry color="#FFAA27" quantity="100" label="Population Count (Estimate)"/>' +
    '<ColorMapEntry color="#FF6625" quantity="500" label="Population Count (Estimate)"/>' +
    '<ColorMapEntry color="#FF0023" quantity="2500" label="Population Count (Estimate)"/>' +
    '<ColorMapEntry color="#CC001A" quantity="5000" label="Population Count (Estimate)"/>' +
    '<ColorMapEntry color="#730009" quantity="185000" label="Population Count (Estimate)"/>' +
    '</ColorMap>' +
    '</RasterSymbolizer>';

// Define a dictionary which will be used to make legend and visualize image on
// map
var dict = {
  'names': [
    '0', '1-5', '6-25', '26-50', '51-100', '101-500', '501-2500', '2501-5000',
    '5001-185000'
  ],
  'colors': [
    '#CCCCCC', '#FFFFBE', '#FEFF73', '#FEFF2C', '#FFAA27', '#FF6625', '#FF0023',
    '#CC001A', '#730009'
  ]
};

// Create a panel to hold the legend widget
var legend = ui.Panel({style: {position: 'bottom-left', padding: '8px 15px'}});

// Function to generate the legend
function addCategoricalLegend(panel, dict, title) {
  // Create and add the legend title.
  var legendTitle = ui.Label({
    value: title,
    style: {
      fontWeight: 'bold',
      fontSize: '18px',
      margin: '0 0 4px 0',
      padding: '0'
    }
  });
  panel.add(legendTitle);

  var loading = ui.Label('Loading legend...', {margin: '2px 0 4px 0'});
  panel.add(loading);

  // Creates and styles 1 row of the legend.
  var makeRow = function(color, name) {
    // Create the label that is actually the colored box.
    var colorBox = ui.Label({
      style: {
        backgroundColor: color,
        // Use padding to give the box height and width.
        padding: '8px',
        margin: '0 0 4px 0'
      }
    });

    // Create the label filled with the description text.
    var description = ui.Label({value: name, style: {margin: '0 0 4px 6px'}});

    return ui.Panel({
      widgets: [colorBox, description],
      layout: ui.Panel.Layout.Flow('horizontal')
    });
  };

  // Get the list of palette colors and class names from the image.
  var palette = dict['colors'];
  var names = dict['names'];
  loading.style().set('shown', false);

  for (var i = 0; i < names.length; i++) {
    panel.add(makeRow(palette[i], names[i]));
  }

  Map.add(panel);
}

addCategoricalLegend(legend, dict, 'Population Count(estimate)');

Map.addLayer(
    landscan_global.sort('system:time_start')
        .first()
        .sldStyle(popcount_intervals),
    {}, 'Population Count Estimate 2000');
Map.addLayer(
    landscan_global.sort('system:time_start', false)
        .first()
        .sldStyle(popcount_intervals),
    {}, 'Population Count Estimate 2022');