Page Summary
-
This dataset provides public preview geospatial data for the column-averaged dry-air mole fraction of methane in the atmosphere (XCH4) from MethaneSAT.
-
The data is available from May 22, 2024, to May 13, 2025, with updates every 7 days.
-
The Level 3 (L3) data is created by regridding Level 2 (L2) data to a regular 45 m x 45 m grid.
-
Due to loss of contact with the satellite, existing datasets will remain accessible, and substantial new data collected prior to the loss will be released.
-
Use of this data requires completing a request form and is subject to specific license terms regarding distribution and creation of derivative products.
- Catalog Owner
- Environmental Defense Fund - MethaneSAT
- Dataset Availability
- 2024-05-22T00:00:00Z–2025-06-14T11:12:26.422000Z
- Dataset Producer
- Environmental Defense Fund - MethaneSAT
- Contact
- EDF-MethaneSAT
- Cadence
- 7 Days
- Tags
Description
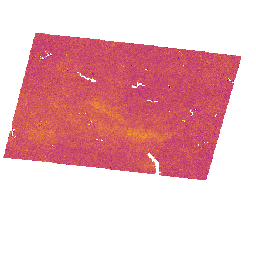
This early "Public Preview" dataset provides geospatial data for the column-averaged dry-air mole fraction of methane in the atmosphere, "XCH4", retrieved from measurements by the MethaneSAT imaging spectrometer. XCH4 is defined as the total column amount (number of molecules above a unit surface area) of methane ("CH4") divided by the total amount of air (number of molecules above a unit surface area, water vapor amount removed) along the line of sight from the satellite’s spectrometer to the Earth's surface and back up to the Sun. Additional data layers are provided for reference: observed albedo at 1622 nm, surface pressure, and terrain height.
The spatial footprint of individual MethaneSAT soundings is 110 m x 400 m when viewing at nadir, with the long side in the satellite’s flight direction, and with the short side that can be stretched wider at higher viewing zenith angles (which is why some targets appear more rectangular than others). At nadir, the swath width is ~220 km. The data on these native soundings is Level 2 (L2) data. The precision of the L2 XCH4 is 22-35 ppb (corresponding to 0.7-0.2 surface albedo). L2 concentrations (XCH4) are retrieved from the measured high resolution (0.08 nm sampling, 0.24 nm resolution) spectra from the 1.6 micron band using the CO2-Proxy method (Chan Miller et al. (2024)). The Level 3 (L3) dataset is created by regridding the L2 data from the native sounding locations to a regular 45 m x 45 m grid using the approach detailed in Sun et al. (2018).
Not all data products (L3 concentration, L4 area and L4 points) are available for all collection IDs. Contact the data provider for more information about the project at this link: https://www.methanesat.org/contact/.
7/2/2025 Important Update:
As you may be aware, we recently lost contact with the satellite. After exploring all possible
recovery options, we have now confirmed that it is no longer functioning, due to an
undetermined problem with the outer platform carrying our methane detector. While there is no
question this is a setback, we are undeterred in our efforts to drive down methane pollution.
Please see our official statement here:
MethaneSAT Loses Contact with Satellite | MethaneSAT.
What this means for the Public Preview data: The existing datasets will remain accessible on Google platforms and on our web portal for the foreseeable future. Additionally, over the next few months, we will release substantial new data collected by MethaneSAT prior to the loss of contact. This will include hundreds of scenes (of targets that are roughly 200kmx200km). We hope this will be useful for you. Should there be any changes to data availability, we will notify you well in advance.
Looking ahead: While we don’t have all the answers yet, we plan to leverage our advanced Data Processing Platform (DPP) to quantify other streams of satellite and/or aerial data. We will also take the necessary time to evaluate the best next step in our efforts to enable methane reductions. To stay up to date with further updates, feel free to sign up for our newsletter.
Bands
Bands
Pixel size: 46.38 meters (all bands)
| Name | Units | Min | Max | Pixel Size | Description |
|---|---|---|---|---|---|
XCH4 |
ppb | 1894* | 2114.65* | 46.38 meters | Retrieved column-averaged dry-air CH4 mole fraction. |
albedo |
0 | 1 | 46.38 meters | Ratio of solar radiance at the ground to observed radiance at the sensor. |
|
surface_pressure |
hPa | 725.95* | 1011.33* | 46.38 meters | Air pressure at the surface. |
terrain_height |
km | 0.026* | 2.915* | 46.38 meters | Elevation with respect to WGS84 reference ellipsoid. |
Image Properties
Image Properties
| Name | Type | Description |
|---|---|---|
| collection_id | STRING | Satellite Observation ID. |
| num_samples | STRING | The integral of the spatial pixel's super Gaussian function over the area of that grid cell. This was the value used in this processing run of this collection. |
| ovr_resampling | STRING | Resampling method used. |
| processing_id | STRING | (internal) Processing run identifier that represents the calculations that led to the features. It is not an attribute describing the flight, but the processing pipeline. |
| target_id | INT | Satellite Target ID. |
| time_coverage_end | STRING | Data collection end time in YYYY-MM-DDThh:mm:ssZ format STRING (ISO 8601). |
| time_coverage_start | STRING | Data collection start time in YYYY-MM-DDThh:mm:ssZ format STRING (ISO 8601). |
Terms of Use
Terms of Use
Use of this data is subject to MethaneSAT's Content License Terms of Use.
YOUR LICENSE TO ACCESS THE DATA
- We hereby grant you a limited, nonexclusive, nonassignable, nontransferable, revocable license to use, reproduce, publish, make derivative works, display and perform publicly any Data first made available through the Platform pursuant to the terms set forth herein, subject to your agreement to, compliance with and satisfaction of these Terms of Use (the “License”)
You agree to and acknowledge the following restrictions relating to the License:
- (1) To access the Data, you must complete this Request Form, which will ask for your contact information, intended use cases, target customers, and other details that will assist MethaneSAT’s understanding of how the Data is being used by you, and, upon submission of such form, MethaneSAT may (in its sole discretion) grant you access to the Data;
(2) With respect to certain aspects of the Data as described herein, you may use methane concentrations, in parts per billion or any other unit of concentration (“Level 3 Data” or “L3 Data”) and methane emission fluxes, in kilograms per hour (“Level 4 Data” or “L4 Data”) for:
- (i) internal business evaluation and testing,
- (ii) commercial applications, such as developing and selling derivative products and services that incorporate or are informed by the L3 Data or L4 Data,
- (iii) distribution of the Data made available herein to wholly controlled affiliates of which you will be responsible and liable on their behalf for adherence to these Terms of Use, or
- (iv) methane mitigation activities, including both commercial and non-commercial initiatives;
(3) You are strictly prohibited from using L3 Data to calculate or derive L4 Data or any similar outputs, except and exclusively for internal use purposes and not to distribute to any third party;
(4) You may not distribute, publish, sublicense, sell, or otherwise provide L3 Data or L4 Data in its raw form to any third parties, provided, however, that you may develop, commercialize, and sell derivative products and services based on your review of the L3 Data and L4 Data, provided, further (and for the avoidance of doubt), that the underlying L3 Data and L4 Data (in its raw form) shall not be shared nor made directly accessible to end users/third parties; and
(5) That you are not permitted to distribute the Data on any other platform that would make the Data available to third parties, other than to you and your wholly controlled affiliates.
As a condition of accessing the Data, you further agree and acknowledge that:
(1) MethaneSAT seeks information about how the Data will be used and, as such, you shall use best efforts, upon request by MethaneSAT, that you will
- (i) provide feedback on the quality of the Data and any proposed improvements thereto, and
- (ii) share anonymized insights on target customers and market applications;
(2) MethaneSAT may use aggregated or anonymized insights to refine its Data offerings.
ATTRIBUTION
If you share or use the Data in any manner with any third parties, you must:
- Explicitly state to these third parties that they are agreeing to be bound by the Terms of Use;
- Display a citation that states: “Data from MethaneSAT” and “Download the most current dataset at Google Earth Engine and/or Google Cloud”; and
- Explicitly state to these third parties that, if such third party creates a further project containing the Data, any such users of that project must also agree to be bound by these Terms of Use.
Citations
Chulakadabba, A., Sargent, M., Lauvaux, T., Benmergui, J. S., Franklin, J. E., Chan Miller, C., Wilzewski, J. S., Roche, S., Conway, E., Souri, A. H., Sun, K., Luo, B., Hawthrone, J., Samra, J., Daube, B. C., Liu, X., Chance, K., Li, Y., Gautam, R., Omara, M., Rutherford, J. S., Sherwin, E. D., Brandt, A., and Wofsy, S. C. 2023. Methane point source quantification using MethaneAIR: a new airborne imaging spectrometer, Atmos. Meas. Tech., 16, 5771-5785. doi:10.5194/amt-16-5771-2023,
Explore with Earth Engine
Code Editor (JavaScript)
// Request access to this data by filling out the form at: https://forms.gle/jqw4Mvr63dsV1fUF8
var dataset = ee.ImageCollection("projects/edf-methanesat-ee/assets/public-preview/L3concentration")
  .filterDate('2024-06-01', '2025-01-31');

var fluxVisParams = {
  bands: ['XCH4'],
  min: 1870,
  max: 2030,
  palette: ['#070088','#a3069b','#cc4e64','#ffa826','#edfb59'],
};

Map.setCenter(-42.26, 42.66, 3);
Map.addLayer(dataset, fluxVisParams, 'Retrieved column-averaged dry-air CH4 mole fraction');