Page Summary
-
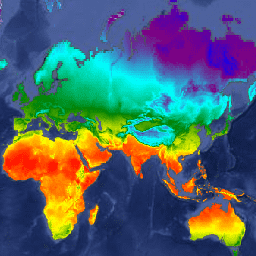
WorldClim version 1 provides average monthly global climate data for minimum, mean, and maximum temperature and precipitation from 1960-01-01 to 1991-01-01.
-
The dataset includes bands for mean temperature (
tavg), minimum temperature (tmin), maximum temperature (tmax), and precipitation (prec), with specified units, ranges, and scale factors. -
This dataset was developed by researchers at the University of California, Berkeley, in collaboration with other institutions.
-
The data is available under the CC-BY-SA-4.0 license and can be explored and analyzed using Google Earth Engine.
-
A citation is provided for users of the dataset.
- Dataset Availability
- 1960-01-01T00:00:00Z–1991-01-01T00:00:00Z
- Dataset Producer
- University of California, Berkeley
- Climatological Interval
- 1 Month
- Tags
Description
WorldClim version 1 has average monthly global climate data for minimum, mean, and maximum temperature and for precipitation.
WorldClim version 1 was developed by Robert J. Hijmans, Susan Cameron, and Juan Parra, at the Museum of Vertebrate Zoology, University of California, Berkeley, in collaboration with Peter Jones and Andrew Jarvis (CIAT), and with Karen Richardson (Rainforest CRC).
Bands
Bands
Pixel size: 927.67 meters (all bands)
| Name | Units | Min | Max | Scale | Pixel Size | Description |
|---|---|---|---|---|---|---|
tavg |
°C | -53.6* | 39.4* | 0.1 | 927.67 meters | Mean temperature |
tmin |
°C | -57.3* | 32.5* | 0.1 | 927.67 meters | Minimum temperature |
tmax |
°C | -50* | 49* | 0.1 | 927.67 meters | Maximum temperature |
prec |
mm | 0* | 2949* | 927.67 meters | Precipitation |
Image Properties
Image Properties
| Name | Type | Description |
|---|---|---|
| month | DOUBLE | Month |
Terms of Use
Terms of Use
Citations
Hijmans, R.J., S.E. Cameron, J.L. Parra, P.G. Jones and A. Jarvis, 2005. Very High Resolution Interpolated Climate Surfaces for Global Land Areas. International Journal of Climatology 25: 1965-1978. doi:10.1002/joc.1276.
Explore with Earth Engine
Code Editor (JavaScript)
var dataset = ee.ImageCollection('WORLDCLIM/V1/MONTHLY');
var meanTemperature = dataset.select('tavg').first().multiply(0.1);
var meanTemperatureVis = {
  min: -40,
  max: 30,
  palette: ['blue', 'purple', 'cyan', 'green', 'yellow', 'red'],
};
Map.setCenter(71.7, 52.4, 3);
Map.addLayer(meanTemperature, meanTemperatureVis, 'Mean Temperature');