Page Summary
-
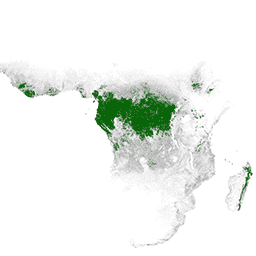
This dataset maps the extent of primary humid tropical forests for the year 2001 at a 30-meter spatial resolution.
-
The map was created by the UMD GLAD team using globally acquired and processed Landsat imagery.
-
The data is available for use without permission, license, or royalty payment, with attribution requested.
- Dataset Availability
- 2001-01-01T00:00:00Z–2002-01-01T00:00:00Z
- Dataset Producer
- UMD/GLAD
- Tags
Description
Primary humid tropical forests provide numerous global ecosystem services, but are under continuing threat of clearing from economic drivers. To facilitate national land use planning and balancing the goals of economic development and maintenance of ecosystem services, a primary humid tropical forest map was created by the UMD GLAD team. The primary forest extent was mapped for the year 2001 at a spatial resolution of 30 meters using globally acquired, free-of-charge, and consistently processed Landsat imagery.
Bands
Bands
Pixel size: 30 meters (all bands)
| Name | Pixel Size | Description |
|---|---|---|
Primary_HT_forests |
30 meters | Primary Humid Tropical Forests |
Primary_HT_forests Class Table
| Value | Color | Description |
|---|---|---|
| 1 | #008000 | Primary Humid Tropical Forests |
Terms of Use
Terms of Use
The data may be used by anyone, anywhere, anytime without permission, license or royalty payment. Attribution using the recommended citation is requested.
Citations
Turubanova S., Potapov P., Tyukavina, A., and Hansen M. (2018) Ongoing primary forest loss in Brazil, Democratic Republic of the Congo, and Indonesia. Environmental Research Letters. https://doi.org/10.1088/1748-9326/aacd1c
Explore with Earth Engine
Code Editor (JavaScript)
var dataset = ee.ImageCollection(
    'UMD/GLAD/PRIMARY_HUMID_TROPICAL_FORESTS/v1').mosaic().selfMask();

var visualization = {
  bands: ['Primary_HT_forests'],
  min: 1.0,
  max: 1.0,
  palette: ['008000']
};

Map.setCenter(0.0, 0.0, 2);

Map.addLayer(dataset, visualization, 'Primary HT forests');