- 資料集開放期間
- 1981-01-01T00:00:00Z–2026-04-26T00:00:00Z
- 資料集產生者
- UCSB/CHC
- 行銷系列活動
- 1 Custom_time_unit
- 標記
說明
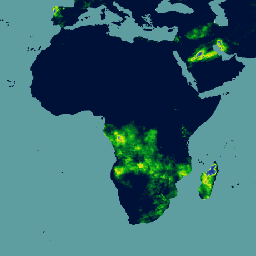
〈Climate Hazards Center Infrared Precipitation with Stations (CHIRPS v3)〉收集時間超過 40 年,是具備高解析度的準全球降雨量資料集。地理範圍涵蓋北緯 60 度到南緯 60 度,包含所有經度,時間始自 1981 年迄今。CHIRPS 第 3 版結合了衛星熱紅外線降雨量預測和現場觀測站的預估結果,可產生 0.05° 網格的陸地降雨量時間序列。這是資料集 3.0 版,詳情請參閱CHC 頁面。
頻帶
波段
像素大小:5566 公尺 (所有頻帶)
| 名稱 | 單位 | 最小值 | 最大值 | 像素大小 | 說明 |
|---|---|---|---|---|---|
precipitation |
毫米/五日 | 0* | 1072.43* | 5566 公尺 | 降水率 |
圖片屬性
影像屬性
| 名稱 | 類型 | 說明 |
|---|---|---|
| month | DOUBLE | 月 |
| pentad | DOUBLE | 五日 |
| year | DOUBLE | 年 |
使用條款
使用條款
這個資料集屬於公有領域內容,在法律允許的範圍內,Pete Peterson 已放棄〈Climate Hazards Center Infrared Precipitation with Stations (CHIRPS)〉的所有著作權,和相關或鄰接權。
參考資料
參考資料:
〈Climate Hazards Center Infrared Precipitation with Stations (Version 3.0)〉。 CHIRPS3 資料存放區 doi:10.15780/G2JQ0P (2025)。
使用 Earth Engine 探索
程式碼編輯器 (JavaScript)
var dataset = ee.ImageCollection('UCSB-CHC/CHIRPS/V3/PENTAD')
                  .filter(ee.Filter.date('2018-05-01', '2018-05-05'));
var precipitation = dataset.select('precipitation');
var precipitationVis = {
  min: 0,
  max: 112,
  palette: ['#001137', '#0aab1e', '#e7eb05', '#2c7fb8', '#253494'],
};
Map.setCenter(17.93, 7.71, 2);
Map.addLayer(precipitation, precipitationVis, 'Precipitation');