- Dataset Availability
- 1981-01-01T00:00:00Z–2026-03-31T00:00:00Z
- Dataset Producer
- UCSB/CHC
- Cadence
- 1 Day
- Tags
Description
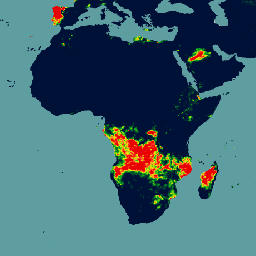
The Climate Hazards Center Infrared Precipitation with Stations (CHIRPS v3) is a 40+ year, high-resolution quasi-global rainfall dataset. It spans 60°N to 60°S and covers all longitudes, providing data from 1981 to near-present. CHIRPS v3 combines satellite-based thermal infrared rainfall estimates with in-situ station observations to produce a 0.05° gridded rainfall time series over land. This is version 3.0 of the dataset, for more information see the CHC page.
CHIRPS is fundamentally a pentad and monthly product from which other time steps are derived. This daily dataset ('rnl') uses daily precipitation from the ECMWF ERA Reanalysis v5 (ERA5) data product to partition pentadal CHIRPS-v3 precipitation totals into daily amounts.
Bands
Bands
Pixel size: 5566 meters (all bands)
| Name | Units | Min | Max | Pixel Size | Description |
|---|---|---|---|---|---|
precipitation |
mm/d | 0* | 1444.34* | 5566 meters | Precipitation |
Image Properties
Image Properties
| Name | Type | Description |
|---|---|---|
| year | DOUBLE | Year |
| month | DOUBLE | Month |
| day | DOUBLE | Day |
Terms of Use
Terms of Use
This dataset is in the public domain. To the extent possible under law, Pete Peterson has waived all copyright and related or neighboring rights to Climate Hazards Center Infrared Precipitation with Stations (CHIRPS).
Citations
Climate Hazards Center Infrared Precipitation with Stations version 3. CHIRPS3 Data Repository doi:10.15780/G2JQ0P (2025).
Explore with Earth Engine
Code Editor (JavaScript)
var dataset = ee.ImageCollection('UCSB-CHC/CHIRPS/V3/DAILY_RNL')
                  .filter(ee.Filter.date('2018-05-01', '2018-05-31'));
var precipitation = dataset.select('precipitation');
var precipitationVis = {
  min: 1.0,
  max: 17.0,
  palette: ['#001137', '#0aab1e', '#e7eb05', '#2c7fb8', '#253494'],
};
Map.setCenter(17.93, 7.71, 2);
Map.addLayer(precipitation, precipitationVis, 'Precipitation');