- Disponibilité de l'ensemble de données
- 2018-01-01T00:00:00Z–2019-01-01T00:00:00Z
- Producteur de l'ensemble de données
- Bureau du recensement des États-Unis
- Tags
Description
L'ensemble de données TIGER du Bureau du recensement des États-Unis contient les limites de 2018 pour les principales divisions juridiques des États américains. Dans la plupart des États, ces entités sont appelées "comtés". En Louisiane, ces divisions sont appelées "paroisses".
L'Alaska compte des entités gouvernementales appelées "boroughs" qui remplissent un rôle gouvernemental similaire à celui des comtés, mais dans certaines régions, ces responsabilités gouvernementales sont gérées directement par l'État et parfois par une ville. Pour l'Alaska, les entités équivalentes aux comtés incluent donc
- les arrondissements organisés ;
- les entités combinées de ville et de borough (par exemple, Juneau) ;
- les municipalités, et
- des zones de recensement.
Les zones de recensement sont délimitées conjointement à des fins statistiques par l'État de l'Alaska et le Bureau du recensement.
Dans quatre États (Maryland, Missouri, Nevada et Virginie), il existe une ou plusieurs villes constituées en municipalité qui sont indépendantes de toute organisation de comté et constituent donc des divisions primaires de leurs États. Ces lieux constitués en municipalité sont appelés villes indépendantes et sont traités comme des entités équivalentes à des comtés pour la présentation des données.
Le district de Columbia et Guam n'ont pas de divisions principales. Chaque zone est considérée comme une entité équivalente à un comté pour la présentation des données. Pour la présentation des données, le Bureau du recensement considère les entités suivantes comme équivalentes aux comtés : les municipios de Porto Rico, les districts et les îles des Samoa américaines, les municipalités du Commonwealth des Îles Mariannes du Nord et les îles des Îles Vierges américaines.
Pour obtenir tous les détails techniques sur les produits TIGER 2018, consultez la documentation technique TIGER.
Schéma de la table
Schéma de table
| Nom | Type | Description |
|---|---|---|
| ALAND | DOUBLE | Superficie |
| AWATER | DOUBLE | Zone d'eau |
| CBSAFP | STRING | Code de la zone statistique métropolitaine/micropolitaine |
| CLASSFP | STRING | Code de classe FIPS |
| COUNTYFP | STRING | Code FIPS du comté |
| COUNTYNS | STRING | Code GNIS du comté |
| CSAFP | STRING | Code de zone statistique combinée |
| FUNCSTAT | STRING | État fonctionnel |
| GEOID | STRING | Identifiant du comté : concaténation du code FIPS de l'État et du code FIPS du comté |
| INTPTLAT | STRING | Latitude du point interne |
| INTPTLON | STRING | Longitude du point interne |
| LSAD | STRING | Description de la zone légale/statistique du comté |
| METDIVFP | STRING | Code de division métropolitaine |
| MTFCC | STRING | Code de catégorie d'entité MAF/TIGER (=G4020) |
| NOM | STRING | Nom du pays |
| NAMELSAD | STRING | Nom et description traduite de la zone juridique/statistique du comté |
| STATEFP | STRING | Code FIPS de l'État |
Conditions d'utilisation
Conditions d'utilisation
Le Bureau du recensement des États-Unis propose certaines de ses données publiques dans un format lisible par machine via une interface de programmation d'application (API). L'ensemble du contenu, de la documentation, du code et des éléments associés mis à disposition par le biais de l'API sont soumis aux présentes conditions d'utilisation.
Citations
Pour la création de rapports, de publications, de nouveaux ensembles de données, de produits dérivés ou de services résultant de l'ensemble de données, les utilisateurs doivent citer le Bureau du recensement des États-Unis.
Explorer avec Earth Engine
Éditeur de code (JavaScript)
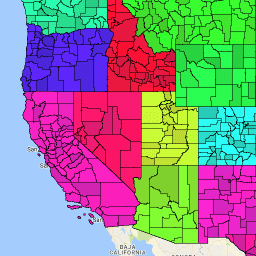
var dataset = ee.FeatureCollection('TIGER/2018/Counties');
var visParams = {
  palette: ['purple', 'blue', 'green', 'yellow', 'orange', 'red'],
  min: 0,
  max: 50,
  opacity: 0.8,
};

// Turn the strings into numbers
dataset = dataset.map(function (f) {
  return f.set('STATEFP', ee.Number.parse(f.get('STATEFP')));
});

var image = ee.Image().float().paint(dataset, 'STATEFP');
var countyOutlines = ee.Image().float().paint({
  featureCollection: dataset,
  color: 'black',
  width: 1
});

Map.setCenter(-99.844, 37.649, 5);
Map.addLayer(image, visParams, 'TIGER/2018/Counties');
Map.addLayer(countyOutlines, {}, 'county outlines');
Map.addLayer(dataset, null, 'for Inspector', false);
Visualiser en tant que FeatureView
Un FeatureView est une représentation accélérée en lecture seule d'un FeatureCollection. Pour en savoir plus, consultez la documentation
FeatureView.
Éditeur de code (JavaScript)
var fvLayer = ui.Map.FeatureViewLayer('TIGER/2018/Counties_FeatureView');

var visParams = {
  opacity: 1,
  polygonStrokeColor: 'black',
  polygonFillColor: {
    property: 'STATEFP',
    categories: [
      ['08', 'purple'],  // Colorado counties
      ['32', 'blue']     // Nevada counties
    ],
    defaultValue: 'white'
  }
};

fvLayer.setVisParams(visParams);
fvLayer.setName('US census counties (FV)');

Map.setCenter(-99.844, 37.649, 5);
Map.add(fvLayer);