- Dataset Availability
- 1981-01-01T00:00:00Z–2026-06-20T12:00:00Z
- Dataset Producer
- PRISM / OREGONSTATE
- Cadence
- 1 Day
- Tags
Description
The PRISM daily and monthly datasets are gridded climate datasets for the conterminous United States, produced by the PRISM Climate Group at Oregon State University. This collection contains both AN81 and AN91 data, indicated by the 'dataset_type' property.
Grids are developed using PRISM (Parameter-elevation Regressions on Independent Slopes Model). PRISM interpolation routines simulate how weather and climate vary with elevation, and account for coastal effects, temperature inversions, and terrain barriers that can cause rain shadows. Station data are assimilated from many networks across the country. For more information, see the Descriptions of PRISM Spatial Climate Datasets.
Note
- Warning: This dataset should not be used to calculate century-long climate trends due to non-climatic variations from to station equipment and location changes, openings and closings, varying observation times, and the use of relatively short-term networks. Please see the dataset documentation for more details.
- The assets have start time of noon UTC, not midnight UTC.
- It takes time for observation networks to conduct quality control and release station data. Therefore, PRISM datasets are re-modeled several times until six months have elapsed, when they are considered permanent. A release schedule is available.
Bands
Bands
Pixel size: 4638.3 meters (all bands)
| Name | Units | Min | Max | Pixel Size | Description |
|---|---|---|---|---|---|
ppt |
mm | 0* | 731.65* | 4638.3 meters | Daily total precipitation (including rain and melted snow) |
tmean |
°C | -40.37* | 45.98* | 4638.3 meters | Daily mean temperature (calculated as (tmin+tmax)/2) |
tmin |
°C | -47.56* | 39.59* | 4638.3 meters | Daily minimum temperature |
tmax |
°C | -38.38* | 54.13* | 4638.3 meters | Daily maximum temperature |
tdmean |
°C | -46.18* | 31.61* | 4638.3 meters | Daily mean dew point temperature |
vpdmin |
hPa | 0* | 69.86* | 4638.3 meters | Daily minimum vapor pressure deficit |
vpdmax |
hPa | 0* | 142.42* | 4638.3 meters | Daily maximum vapor pressure deficit |
Image Properties
Image Properties
| Name | Type | Description |
|---|---|---|
| PRISM_CODE_VERSION | STRING_LIST | List of code versions per band, e.g: the first element is for the first band "ppt", the second element is for the second band "tmean" |
| PRISM_DATASET_CREATE_DATE | STRING_LIST | List of original creation dates per band in the format YYYYMMDD |
| PRISM_DATASET_FILENAME | STRING_LIST | List of original filenames for each band |
| PRISM_DATASET_TYPE | STRING_LIST | List of dataset types per band |
| PRISM_DATASET_VERSION | STRING_LIST | List of dataset versions per band e.g: D1 or D2 for daily products; M1, M2 or M3 for monthly products. |
| PRISM_DATASET_RELEASE_NUMBER | INT_LIST | An integer (1-8) per band, indicating how many times a grid has been re-modeled within the 6-month window. Grids are considered stable after 6 months. This property is not present on AN81 data. |
| dataset_type | STRING | Dataset type: "AN81" or "AN91" |
Terms of Use
Terms of Use
These PRISM datasets are available without restriction on use or distribution. PRISM Climate Group does request that the user give proper attribution and identify PRISM, where applicable, as the source of the data.
Citations
[Daly, C., J.I. Smith, and K.V. Olson. 2015. Mapping atmospheric moisture climatologies across the conterminous United States. PloS ONE 10(10):e0141140. doi:10.1371/journal.pone.0141140.
DOIs
Explore with Earth Engine
Code Editor (JavaScript)
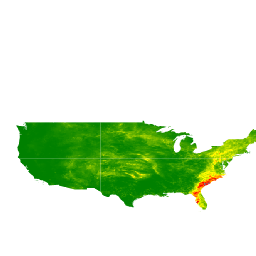
var dataset = ee.ImageCollection('OREGONSTATE/PRISM/ANd')
                  .filter(ee.Filter.date('2024-08-01', '2024-08-15'));
var precipitation = dataset.select('ppt');
var precipitationVis = {
  min: 0.0,
  max: 50.0,
  palette: ['green', 'yellow', 'red', 'cyan', 'purple'],
};
Map.setCenter(-100.55, 40.71, 4);
Map.addLayer(precipitation, precipitationVis, 'Precipitation');