Page Summary
-
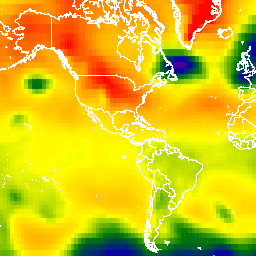
The dataset provides sea level pressure data from 1948 to near present with 6-hour temporal and 2.5-degree spatial resolution.
-
This dataset is part of the NCEP/NCAR Reanalysis Project, which aims to produce atmospheric analyses using historical and current data.
-
The data includes a band named 'slp' representing sea level pressure in millibars with estimated min and max values.
-
There are no restrictions on the use of these datasets.
-
This dataset can be explored and analyzed using the Google Earth Engine platform.
- Dataset Availability
- 1948-01-01T00:00:00Z–2026-03-18T00:00:00Z
- Dataset Producer
- NCEP
- Cadence
- 6 Hours
- Tags
Description
The NCEP/NCAR Reanalysis Project is a joint project between the National Centers for Environmental Prediction (NCEP, formerly "NMC") and the National Center for Atmospheric Research (NCAR). The goal of this joint effort is to produce new atmospheric analyses using historical data as well as to produce analyses of the current atmospheric state (Climate Data Assimilation System, CDAS). The NCEP/NCAR Reanalysis 1 project is using a state-of-the-art analysis/forecast system to perform data assimilation using past data from 1948 to March 2026. The data have 6-hour temporal resolution (0000, 0600, 1200, and 1800 UTC) and 2.5 degree spatial resolution.
NCEP discontinued this dataset in March 2026 and it is no longer being updated.
Bands
Bands
Pixel size: 278300 meters (all bands)
| Name | Units | Min | Max | Scale | Pixel Size | Description |
|---|---|---|---|---|---|---|
slp |
mbar | 92590* | 112590* | 0.01 | 278300 meters | Sea level pressure |
Terms of Use
Terms of Use
There are no restrictions on the use of these datasets.
Citations
Kalnay et al., 1996, The NCEP/NCAR 40-Year Reanalysis Project. Bull. Amer. Meteor. Soc., 77, 437-471. doi:10.1175/1520-0477(1996)0770437:TNYRP\2.0.CO;2.
Explore with Earth Engine
Code Editor (JavaScript)
var dataset = ee.ImageCollection('NCEP_RE/sea_level_pressure')
                  .filter(ee.Filter.date('2018-08-01', '2018-08-15'));
var seaLevelPressure = dataset.select('slp');
var seaLevelPressureVis = {
  min: 96500.0,
  max: 104500.0,
  palette: ['800080', '0000ab', '008000', 'ffff00', 'ffa500', 'ff0000'],
};
Map.setCenter(-88.6, 26.4, 1);
Map.addLayer(seaLevelPressure, seaLevelPressureVis, 'Sea Level Pressure');