- Disponibilidad del conjunto de datos
- 2010-01-01T00:00:00Z–2010-12-31T00:00:00Z
- Proveedor del conjunto de datos
- DAAC de ORNL de la NASA en el Laboratorio Nacional de Oak Ridge
- Cadencia
- 1 año
- Etiquetas
Descripción
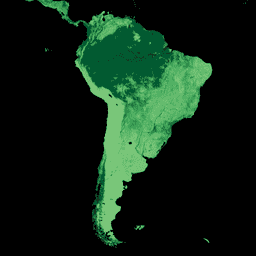
Este conjunto de datos proporciona mapas globales armonizados y coherentes en el tiempo de la densidad de carbono de la biomasa subterránea y sobre el suelo para el año 2010 con una resolución espacial de 300 m. El mapa de biomasa sobre el suelo integra mapas específicos de la cobertura del suelo y detectados de forma remota de biomasa de bosques, pastizales, tierras de cultivo y tundra. Los mapas de entrada se recopilaron de la literatura publicada y, cuando fue necesario, se actualizaron para abarcar la extensión o el período focal. Del mismo modo, el mapa de biomasa subterránea integra mapas coincidentes derivados de cada mapa de biomasa aérea y modelos empíricos específicos de la cobertura del suelo. Luego, los mapas de superficie y subterráneos se integraron por separado con mapas auxiliares del porcentaje de cobertura arbórea y la cobertura del suelo, y un árbol de decisión basado en reglas. También se proporcionan mapas que indican la incertidumbre acumulada de las estimaciones a nivel del píxel.
Nota del proveedor: El conjunto de datos de biomasa de carbono del Centro de Monitoreo de la Conservación Mundial del Programa de las Naciones Unidas para el Medio Ambiente (PNUMA-CMCM) representa las condiciones entre 1982 y 2010, según el tipo de cobertura terrestre. Los patrones relativos de las reservas de carbono están bien representados con este conjunto de datos. El conjunto de datos de biomasa de carbono de la NASA/ORNL representa las condiciones de biomasa para el 2010, con estimaciones de incertidumbre a nivel del píxel. La biomasa adicional de los tipos de cobertura terrestre no dominantes se representa dentro de cada píxel. Para obtener información más detallada, consulta los documentos que describen cada conjunto de datos: WCMC (Soto-Navarro et al., 2020) y NASA/ORNL (Spawn et al., 2020).
Bandas
Bandas
Tamaño de píxel: 300 metros (todas las bandas)
| Nombre | Unidades | Mín. | Máx. | Tamaño de los píxeles | Descripción |
|---|---|---|---|---|---|
agb |
Mg/ha | 0* | 129* | 300 metros | Densidad de la biomasa viva sobre el suelo de la combinación de cobertura leñosa y herbácea en 2010. Esto incluye el carbono almacenado en los tejidos de las plantas vivas que se encuentran sobre la superficie de la Tierra (tallos, corteza, ramas y ramitas). Esto no incluye la hojarasca ni los residuos leñosos gruesos que alguna vez estuvieron adheridos a plantas vivas, pero que se depositaron y ya no están vivos. |
agb_uncertainty |
Mg/ha | 0* | 85* | 300 metros | Incertidumbre de la densidad de carbono estimada de la biomasa viva sobre el suelo de la cobertura combinada de plantas leñosas y herbáceas en 2010. La incertidumbre representa el error estándar acumulativo que se propagó a través del proceso de armonización con la suma en cuadratura. |
bgb |
Mg/ha | 0* | 57* | 300 metros | Densidad de la reserva de carbono de la biomasa viva subterránea de la cobertura combinada de plantas leñosas y herbáceas en 2010. Esto incluye el carbono almacenado en los tejidos de las plantas vivas que se encuentran debajo de la superficie de la tierra (raíces). Esto no incluye el tejido radicular muerto o dislocado, ni la materia orgánica del suelo. |
bgb_uncertainty |
Mg/ha | 0* | 37* | 300 metros | Incertidumbre de la densidad de carbono de la biomasa viva subterránea estimada de la cobertura combinada de plantas leñosas y herbáceas en 2010. La incertidumbre representa el error estándar acumulativo que se propagó a través del proceso de armonización con la suma en cuadratura. |
Condiciones de Uso
Condiciones de Uso
Este conjunto de datos es de dominio público y está disponible sin restricciones de uso ni distribución. Consulta la Política de datos e información de ciencias de la Tierra de la NASA para obtener más información.
Citas
Spawn, S.A., Sullivan, C.C., Lark, T.J. et al. Harmonized global maps of above and belowground biomass carbon density in the year 2010. Sci Data 7, 112 (2020). doi:10.1038/s41597-020-0444-4
Spawn, S.A., y H.K. Gibbs. 2020 Mapas globales de densidad de carbono de biomasa sobre y bajo el suelo para el año 2010. ORNL DAAC, Oak Ridge, Tennessee, EE.UU.
DOI
Explora con Earth Engine
Editor de código (JavaScript)
var dataset = ee.ImageCollection('NASA/ORNL/biomass_carbon_density/v1');

var visualization = {
  bands: ['agb'],
  min: -50.0,
  max: 80.0,
  palette: ['d9f0a3', 'addd8e', '78c679', '41ab5d', '238443', '005a32']
};

Map.setCenter(-60.0, 7.0, 4);

Map.addLayer(dataset, visualization, 'Aboveground biomass carbon');