Page Summary
-
The M2T1NXRAD dataset, part of MERRA-2, provides hourly time-averaged radiation diagnostics from 1980 to present.
-
This dataset includes variables such as surface albedo, cloud area fraction, cloud optical thickness, and various shortwave and longwave radiation fluxes.
-
The data is produced by NASA GMAO using the GEOS model and is updated with a latency of approximately 3 weeks after the end of each month.
-
NASA promotes the full and open sharing of this data.
- Dataset Availability
- 1980-01-01T00:00:00Z–2026-06-01T23:00:00Z
- Dataset Producer
- NASA/MERRA
- Cadence
- 1 Hour
- Tags
Description
M2T1NXRAD (or tavg1_2d_rad_Nx) is an hourly time-averaged data collection in Modern-Era Retrospective analysis for Research and Applications version 2 (MERRA-2). This collection consists of radiation diagnostics, such as surface albedo, cloud area fraction, in cloud optical thickness, surface incoming shortwave flux (i.e. solar radiation), surface net downward shortwave flux, and upwelling longwave flux at TOA (top of atmosphere) (i.e. outgoing longwave radiation (OLR) at TOA). The data field is time-stamped with the central time of an hour starting from 00:30 UTC, e.g.: 00:30, 01:30, ... , 23:30 UTC.
MERRA-2 is the latest version of global atmospheric reanalysis for the satellite era produced by NASA Global Modeling and Assimilation Office (GMAO) using the Goddard Earth Observing System Model (GEOS) version 5.12.4. The dataset covers the period of 1980-present with the latency of ~3 weeks after the end of a month.
Bands
Bands
Pixel size: 69375x55000 meters (all bands)
| Name | Units | Min | Max | Pixel Size | Description |
|---|---|---|---|---|---|
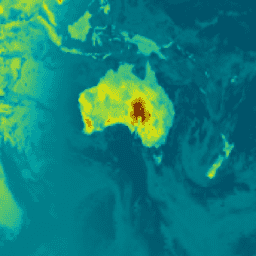
ALBEDO |
0.01* | 0.898471* | 69375x55000 meters | Surface albedo |
|
ALBNIRDF |
0.017455* | 0.820016* | 69375x55000 meters | Surface albedo for near infrared diffuse |
|
ALBNIRDR |
0.018709* | 0.82001* | 69375x55000 meters | Surface albedo for near infrared beam |
|
ALBVISDF |
0.016788* | 0.959771* | 69375x55000 meters | Surface albedo for visible diffuse |
|
ALBVISDR |
0.01853* | 0.959762* | 69375x55000 meters | Surface albedo for visible beam |
|
CLDHGH |
0* | 0.999236* | 69375x55000 meters | Cloud area fraction for high clouds |
|
CLDLOW |
0* | 0.999997* | 69375x55000 meters | Cloud area fraction for low clouds |
|
CLDMID |
0* | 0.998779* | 69375x55000 meters | Cloud area fraction for middle clouds |
|
CLDTOT |
0* | 1* | 69375x55000 meters | Total cloud area fraction |
|
EMIS |
0.943074* | 0.999993* | 69375x55000 meters | Surface emissivity |
|
LWGABCLRCLN |
W/m^2 | 41.1408* | 458.523* | 69375x55000 meters | Surface absorbed longwave radiation assuming clear sky and no aerosol |
LWGABCLR |
W/m^2 | 41.1414* | 465.929* | 69375x55000 meters | Surface absorbed longwave radiation assuming clear sky |
LWGAB |
W/m^2 | 41.1446* | 482.398* | 69375x55000 meters | Surface absorbed longwave radiation |
LWGEM |
W/m^2 | 67.5297* | 630.29* | 69375x55000 meters | Longwave flux emitted from surface |
LWGNTCLRCLN |
W/m^2 | -248.748* | 61.0736* | 69375x55000 meters | Surface net downward longwave flux assuming clear sky and no aerosol |
LWGNTCLR |
W/m^2 | -248.653* | 62.2794* | 69375x55000 meters | Surface net downward longwave flux assuming clear sky |
LWGNT |
W/m^2 | -268.862* | 77.255* | 69375x55000 meters | Surface net downward longwave flux |
LWTUPCLRCLN |
W/m^2 | 80.6768* | 372.229* | 69375x55000 meters | Upwelling longwave flux at TOA assuming clear sky and no aerosol |
LWTUPCLR |
W/m^2 | 80.6768* | 372.229* | 69375x55000 meters | Upwelling longwave flux at TOA assuming clear sky |
LWTUP |
W/m^2 | 80.6506* | 370.868* | 69375x55000 meters | Upwelling longwave flux at TOA |
SWGDNCLR |
W/m^2 | -0.008217* | 1155.5* | 69375x55000 meters | Surface incoming shortwave flux assuming clear sky |
SWGDN |
W/m^2 | 0* | 1127.49* | 69375x55000 meters | Surface incoming shortwave flux |
SWGNTCLN |
W/m^2 | 0* | 1088.42* | 69375x55000 meters | Surface net downward shortwave flux assuming no aerosol |
SWGNTCLRCLN |
W/m^2 | -3.2e-05* | 1088.42* | 69375x55000 meters | Surface net downward shortwave flux assuming clear sky and no aerosol |
SWGNTCLR |
W/m^2 | -0.001333* | 1083.95* | 69375x55000 meters | Surface net downward shortwave flux assuming clear sky |
SWGNT |
W/m^2 | 0* | 1083.95* | 69375x55000 meters | Surface net downward shortwave flux |
SWTDN |
W/m^2 | 0* | 1404.28* | 69375x55000 meters | TOA incoming shortwave flux |
SWTNTCLN |
W/m^2 | 0* | 1315.89* | 69375x55000 meters | TOA net downward shortwave flux assuming no aerosol |
SWTNTCLRCLN |
W/m^2 | 0* | 1317.5* | 69375x55000 meters | TOA net downward shortwave flux assuming clear sky and no aerosol |
SWTNTCLR |
W/m^2 | 0* | 1316.5* | 69375x55000 meters | TOA net downward shortwave flux assuming clear sky |
SWTNT |
W/m^2 | 0* | 1313.33* | 69375x55000 meters | TOA net downward shortwave flux |
TAUHGH |
0* | 142.188* | 69375x55000 meters | In cloud optical thickness of high clouds(export) |
|
TAULOW |
0* | 318.218* | 69375x55000 meters | In cloud optical thickness of low clouds |
|
TAUMID |
0* | 252.995* | 69375x55000 meters | In cloud optical thickness of middle clouds |
|
TAUTOT |
0* | 348.125* | 69375x55000 meters | In cloud optical thickness of all clouds |
|
TS |
K | 185.73* | 328.864* | 69375x55000 meters | Surface skin temperature |
Terms of Use
Terms of Use
NASA promotes the full and open sharing of all data with research and applications communities, private industry, academia, and the general public.
Explore with Earth Engine
Code Editor (JavaScript)
var dataset = ee.ImageCollection('NASA/GSFC/MERRA/rad/2')
                  .filter(ee.Filter.date('2022-02-01', '2022-02-02')).first();
var surface_albedo = dataset.select('ALBEDO');
var saVis = {
  min: -0.428147,
  max: 0.833350,
  palette: ['001137', '01abab', 'e7eb05', '620500']
};
Map.setCenter(-95, 39, 2);
Map.addLayer(surface_albedo, saVis, 'Surface albedo');