- Dataset Availability
- 2018-07-09T00:00:00Z–2026-06-04T19:48:30Z
- Dataset Producer
- Land Processes Distributed Active Archive Center
- Cadence
- 1 Day
- Tags
Description
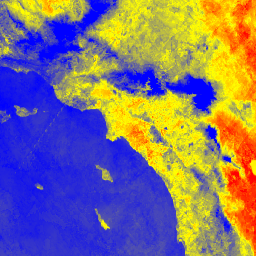
The ECOSTRESS Land Surface Temperature and Emissivity (ECO_L2T_LSTE) V002 dataset provides Land Surface Temperature (LST), LST error, Quality Control flags, Broadband Emissivity, cloud mask, surface height, water mask, and view zenith angle data at a 70m spatial resolution. This product is derived from ECOSTRESS observations and is essential for understanding surface energy balance and water stress.
NOTE: Currently, only tiles covering the Los Angeles metro area have been ingested into Earth Engine. We plan to expand coverage in the future.
Documentation:
Bands
Bands
Pixel size: 70 meters (all bands)
| Name | Units | Pixel Size | Description | ||||||||||||||||||||||||||||||||||||||||||||||||||||||||||||||||||||||||||||||||||||||||||||||||
|---|---|---|---|---|---|---|---|---|---|---|---|---|---|---|---|---|---|---|---|---|---|---|---|---|---|---|---|---|---|---|---|---|---|---|---|---|---|---|---|---|---|---|---|---|---|---|---|---|---|---|---|---|---|---|---|---|---|---|---|---|---|---|---|---|---|---|---|---|---|---|---|---|---|---|---|---|---|---|---|---|---|---|---|---|---|---|---|---|---|---|---|---|---|---|---|---|---|---|---|
LST |
K | 70 meters | Land Surface Temperature |
||||||||||||||||||||||||||||||||||||||||||||||||||||||||||||||||||||||||||||||||||||||||||||||||
LST_err |
K | 70 meters | Land Surface Temperature error |
||||||||||||||||||||||||||||||||||||||||||||||||||||||||||||||||||||||||||||||||||||||||||||||||
QC |
70 meters | Quality Control flags for LST and emissivity |
|||||||||||||||||||||||||||||||||||||||||||||||||||||||||||||||||||||||||||||||||||||||||||||||||
EmisWB |
70 meters | Wide band Emissivity |
|||||||||||||||||||||||||||||||||||||||||||||||||||||||||||||||||||||||||||||||||||||||||||||||||
cloud |
70 meters | Cloud mask |
|||||||||||||||||||||||||||||||||||||||||||||||||||||||||||||||||||||||||||||||||||||||||||||||||
height |
m | 70 meters | Surface elevation of observation" |
||||||||||||||||||||||||||||||||||||||||||||||||||||||||||||||||||||||||||||||||||||||||||||||||
water |
70 meters | Water mask |
|||||||||||||||||||||||||||||||||||||||||||||||||||||||||||||||||||||||||||||||||||||||||||||||||
view_zenith |
deg | 70 meters | View Zenith Angle |
||||||||||||||||||||||||||||||||||||||||||||||||||||||||||||||||||||||||||||||||||||||||||||||||
Terms of Use
Terms of Use
LP DAAC NASA data are freely accessible; however, when an author publishes these data or works based on the data, it is requested that the author cite the datasets within the text of the publication and include a reference to them in the reference list.
Citations
Hook, Simon, et al. ECOSTRESS Land Surface Temperature and Emissivity L2 Global 70 m v002. NASA Land Processes Distributed Active Archive Center, 2023, doi:10.5067/ECOSTRESS/ECO_L2T_LSTE.002
DOIs
Explore with Earth Engine
Code Editor (JavaScript)
var image_collection = ee.ImageCollection('NASA/ECOSTRESS/L2T_LSTE/V2')
                  .filter(ee.Filter.date('2025-03-01', '2025-05-01'));
Map.setCenter(-118.2437, 34.0522, 10);
var lst = image_collection.select('LST').mean();

var lstVis = {
  min: 285,
  max: 305,
  palette: ['blue', 'cyan', 'green', 'yellow', 'orange', 'red'],
};
Map.addLayer(lst, lstVis, 'LST');

var lstErr = image_collection.select('LST_err');
var lstErrVis = {
  min: 2.8399999141693115,
  max: 3.200000047683716,
  palette: ['green', 'yellow', 'red'],
};
Map.addLayer(lstErr, lstErrVis, 'LST_err');

var qc = image_collection.select('QC');
var qcVis = {
  min: 0,
  max: 2497,
  palette: ['black', 'purple', 'white'],
};
Map.addLayer(qc, qcVis, 'QC');

var emisWB = image_collection.select('EmisWB');
var emisWBVis = {
  min: 0.8859999775886536,
  max: 0.9459999799728394,
  palette: ['blue', 'cyan', 'green'],
};
Map.addLayer(emisWB, emisWBVis, 'EmisWB');

var cloud = image_collection.select('cloud');
var cloudVis = {
  min: 0,
  max: 1,
  palette: ['red', 'white'],
};
Map.addLayer(cloud, cloudVis, 'cloud');

var height = image_collection.select('height');
var heightVis = {
  min: 46.57216262817383,
  max: 47.15089416503906,
  palette: ['brown', 'grey', 'white'],
};
Map.addLayer(height, heightVis, 'height');

var water = image_collection.select('water');
var waterVis = {
  min: 0,
  max: 1,
  palette: ['red', 'blue'],
};
Map.addLayer(water, waterVis, 'water');

var viewZenith = image_collection.select('view_zenith');
var viewZenithVis = {
  min: 27.346546173095703,
  max: 28.611562728881836,
  palette: ['yellow', 'orange', 'red'],
};
Map.addLayer(viewZenith, viewZenithVis, 'view_zenith');