Page Summary
-
The Advanced Spaceborne Thermal Emission and Reflection Radiometer Global Emissivity Database (ASTER-GED) was developed by NASA's Jet Propulsion Laboratory.
-
This product includes data such as mean emissivity for ASTER Thermal Infrared bands, mean land surface temperature, a re-sampled ASTER GDEM, land-water mask, mean Normalized Difference Vegetation Index (NDVI), and observation count.
-
ASTER-GED land surface temperature and emissivity are generated using the ASTER Temperature Emissivity Separation (TES) algorithm combined with a Water Vapor Scaling atmospheric correction method.
-
This product was derived from clear-sky pixels from ASTER data collected between 2000 and 2008.
-
ASTER data and products from LP DAAC, excluding ASTER GDEM v2, have no restrictions on use, sale, or redistribution.
- Dataset Availability
- 2000-01-01T00:00:00Z–2008-12-31T00:00:00Z
- Dataset Producer
- NASA LP DAAC at the USGS EROS Center
- Tags
Description
The Advanced Spaceborne Thermal Emission and Reflection Radiometer Global Emissivity Database (ASTER-GED) was developed by the National Aeronautics and Space Administration's (NASA) Jet Propulsion Laboratory (JPL), California Institute of Technology. This product includes the mean emissivity and standard deviation for all 5 ASTER Thermal Infrared bands, mean land surface temperature (LST) and standard deviation, a re-sampled ASTER GDEM, land-water mask, mean Normalized Difference Vegetation Index (NDVI) and standard deviation, and observation count.
ASTER-GED land surface temperature and emissivity (LST&E) are generated using the ASTER Temperature Emissivity Separation (TES) algorithm in combination with a Water Vapor Scaling (WVS) atmospheric correction method using MODIS MOD07 atmospheric profiles and the MODTRAN 5.2 radiative transfer model.
This product was derived from clear-sky pixels for all available ASTER data (2000-2008).
Bands
Bands
Pixel size: 100 meters (all bands)
| Name | Units | Min | Max | Scale | Pixel Size | Description |
|---|---|---|---|---|---|---|
emissivity_band10 |
0 | 1000 | 0.001 | 100 meters | Mean band 10 |
|
emissivity_band11 |
0 | 1000 | 0.001 | 100 meters | Mean band 11 |
|
emissivity_band12 |
0 | 1000 | 0.001 | 100 meters | Mean band 12 |
|
emissivity_band13 |
0 | 1000 | 0.001 | 100 meters | Mean band 13 |
|
emissivity_band14 |
0 | 1000 | 0.001 | 100 meters | Mean band 14 |
|
emissivity_sdev_band10 |
-1000 | 1000 | 0.0001 | 100 meters | Standard deviation band 10 |
|
emissivity_sdev_band11 |
-1000 | 1000 | 0.0001 | 100 meters | Standard deviation band 11 |
|
emissivity_sdev_band12 |
-1000 | 1000 | 0.0001 | 100 meters | Standard deviation band 12 |
|
emissivity_sdev_band13 |
-1000 | 1000 | 0.0001 | 100 meters | Standard deviation band 13 |
|
emissivity_sdev_band14 |
-1000 | 1000 | 0.0001 | 100 meters | Standard deviation band 14 |
|
temperature |
K | 0 | 65535 | 0.01 | 100 meters | Temperature mean |
temperature_sdev |
K | 0 | 65535 | 0.01 | 100 meters | Temperature standard deviation |
ndvi |
0 | 100 | 0.01 | 100 meters | NDVI mean |
|
ndvi_sdev |
0 | 100 | 0.01 | 100 meters | NDVI standard deviation |
|
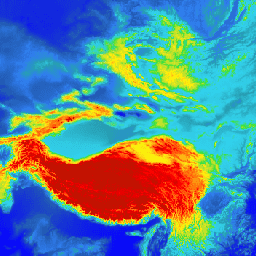
elevation |
m | -500 | 9000 | 100 meters | ASTER Global Digital Elevation Model V002 |
|
land_water_map |
100 meters | Land water map |
||||
num_obs |
Number per pixel | 0* | 120* | 100 meters | Number of observations |
land_water_map Class Table
| Value | Color | Description |
|---|---|---|
| 1 | brown | Land |
| 2 | blue | Water |
Terms of Use
Terms of Use
ASTER data and products distributed by the LP DAAC, with the exception of the ASTER Global Digital Elevation Model (GDEM) dataset (ASTGTM) version 2 (v2), have no restrictions on data use, sale, or subsequent redistribution. For more information visit the ASTER Policies site.
Citations
Please visit LP DAAC 'Citing Our Data' page for information on citing LP DAAC datasets.
DOIs
Explore with Earth Engine
Code Editor (JavaScript)
var dataset = ee.Image('NASA/ASTER_GED/AG100_003');
var elevation = dataset.select('elevation');
var elevationVis = {
  min: -15.0,
  max: 5000.0,
  palette: [
    '0602ff', '235cb1', '307ef3', '269db1', '30c8e2', '32d3ef', '3ae237',
    'b5e22e', 'd6e21f', 'fff705', 'ffd611', 'ffb613', 'ff8b13', 'ff6e08',
    'ff500d', 'ff0000', 'de0101', 'c21301'
  ],
};
Map.setCenter(89.12, 37.72, 3);
Map.addLayer(elevation, elevationVis, 'Elevation');