- 데이터 세트 제공
- 2001-01-01T00:00:00Z–2021-01-01T00:00:00Z
- 데이터 세트 제작자
- 유럽연합 집행위원회, 공동 연구 센터, 글로벌 산불 정보 시스템
- 태그
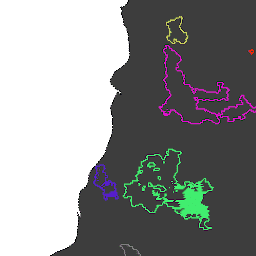
설명
MODIS 데이터 세트 MCD64A1을 기반으로 한 화재 경계입니다. 이 데이터는 불에 탄 지역의 패치 간 시공간 관계를 그래프 구조로 인코딩하는 알고리즘을 기반으로 계산되었습니다.
각 화재에는 이벤트를 식별하는 고유한 번호가 있습니다.
표 스키마
표 스키마
| 이름 | 유형 | 설명 |
|---|---|---|
| ID | INT | 화재의 숫자 ID |
| InitialDate | INT | 1970년 1월 1일 이후의 초기 실행 날짜(밀리초) |
이용약관
이용약관
인용
인용:
Artés, T., Oom, D., De Rigo, D., Durrant, T. H., Maianti, P., Libertà, G., & San-Miguel-Ayanz, J. (2019). 화재 발생 패턴 및 화재 행동 분석을 위한 전역 산불 데이터 세트입니다. Scientific data, 6(1), 1-11. doi:10.1038/s41597-019-0312-2
DOI
Earth Engine으로 탐색
코드 편집기(JavaScript)
// Folder name for a series of tables.
var folder = 'JRC/GWIS/GlobFire/v2/DailyPerimeters';

// List available tables using ee.data.listAssets with asynchronous callback.
function printAssetList(listAssetsOutput) {
  print('Asset list:', listAssetsOutput['assets']);
}
ee.data.listAssets(folder, {}, printAssetList);

// Define a table name (table id) identified from the list of available tables.
var tableName = 'JRC/GWIS/GlobFire/v2/DailyPerimeters/2020';

var computeArea = function(f) {
  return f.set({'area': f.area()});
};

// Import a selected table as a FeatureCollection.
var features = ee.FeatureCollection(tableName).map(computeArea);

// Visualization parameters for linear fire area gradient.
var visParams = {
  palette: ['f5ff64', 'b5ffb4', 'beeaff', 'ffc0e8', '8e8dff', 'adadad'],
  min: 0,
  max: 600000000,
  opacity: 0.8,
};

// Paint fire perimeters to an image using computed fire area as the value property.
var image = ee.Image().float().paint(features, 'area');

// Display the image to the map (include features for exploring with Inspector).
Map.addLayer(image, visParams, 'GlobFire 2020');
Map.addLayer(features, null, 'For Inspector', false);
Map.setCenter(-121.23, 39.7, 12);