- Ketersediaan Set Data
- 2015-06-27T00:00:00Z–2026-07-15T00:55:21.805000Z
- Produsen Set Data
- World Resources Institute Google
- Tag
Deskripsi
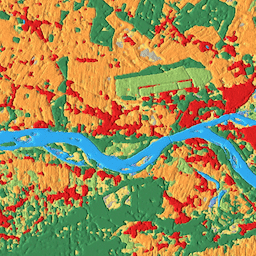
Dynamic World adalah set data Penggunaan Lahan/Land Cover (LULC) 10 m yang mendekati real-time (NRT) yang mencakup probabilitas kelas dan informasi label untuk sembilan kelas.
Prediksi Dynamic World tersedia untuk koleksi Sentinel-2 L1C dari 27-06-2015 hingga saat ini. Frekuensi kunjungan ulang Sentinel-2 adalah antara 2-5 hari, bergantung pada lintang. Prediksi Dynamic World dibuat untuk gambar L1C Sentinel-2 dengan CLOUDY_PIXEL_PERCENTAGE <= 35%. Prediksi ditutupi untuk menghilangkan awan dan bayangan awan menggunakan kombinasi Probabilitas Awan S2, Indeks Perpindahan Awan, dan Directional Distance Transform.
Gambar dalam koleksi Dynamic World memiliki nama yang cocok dengan nama aset Sentinel-2 L1C individual yang menjadi dasarnya, misalnya:
ee.Image('COPERNICUS/S2/20160711T084022_20160711T084751_T35PKT')
memiliki gambar Dynamic World yang cocok bernama: ee.Image('GOOGLE/DYNAMICWORLD/V1/20160711T084022_20160711T084751_T35PKT').
Semua rentang probabilitas kecuali rentang "label" secara kolektif berjumlah 1.
Untuk mempelajari lebih lanjut set data Dynamic World dan melihat contoh untuk membuat komposit, menghitung statistik regional, dan menggunakan deret waktu, lihat seri tutorial Pengantar Dynamic World.
Estimasi kelas Dunia Dinamis diberikan yang berasal dari gambar tunggal menggunakan konteks spasial dari jendela bergerak kecil, "probabilitas" top-1 untuk prediksi penutup lahan yang sebagian ditentukan oleh penutup dari waktu ke waktu, seperti tanaman, dapat relatif rendah jika tidak ada fitur pembeda yang jelas. Permukaan dengan pantulan tinggi di iklim kering, pasir, pantulan sinar matahari, dll. juga dapat menunjukkan fenomena ini.
Untuk memilih hanya piksel yang secara meyakinkan termasuk dalam kelas Dynamic World, sebaiknya masking output Dynamic World dilakukan dengan menerapkan nilai minimum "probabilitas" yang diperkirakan dari prediksi top-1.
Band
Band
Ukuran piksel: 10 meter (semua band)
| Nama | Min | Maks | Ukuran Piksel | Deskripsi |
|---|---|---|---|---|
water |
0 | 1 | 10 meter | Perkiraan probabilitas cakupan lengkap oleh air |
trees |
0 | 1 | 10 meter | Perkiraan probabilitas cakupan lengkap oleh pepohonan |
grass |
0 | 1 | 10 meter | Estimasi probabilitas cakupan lengkap oleh rumput |
flooded_vegetation |
0 | 1 | 10 meter | Perkiraan probabilitas cakupan lengkap oleh vegetasi yang tergenang banjir |
crops |
0 | 1 | 10 meter | Estimasi probabilitas cakupan lengkap menurut tanaman |
shrub_and_scrub |
0 | 1 | 10 meter | Estimasi probabilitas cakupan lengkap semak dan belukar |
built |
0 | 1 | 10 meter | Estimasi probabilitas cakupan lengkap menurut bangunan |
bare |
0 | 1 | 10 meter | Estimasi probabilitas cakupan lengkap dengan kondisi telanjang |
snow_and_ice |
0 | 1 | 10 meter | Perkiraan probabilitas cakupan lengkap oleh salju dan es |
label |
0 | 8 | 10 meter | Indeks band dengan estimasi probabilitas tertinggi |
Tabel Class label
| Nilai | Warna | Deskripsi |
|---|---|---|
| 0 | #419bdf | air |
| 1 | #397d49 | pepohonan |
| 2 | #88b053 | rumput |
| 3 | #7a87c6 | flooded_vegetation |
| 4 | #e49635 | tanaman |
| 5 | #dfc35a | shrub_and_scrub |
| 6 | #c4281b | dibangun |
| 7 | #a59b8f | telanjang |
| 8 | #b39fe1 | snow_and_ice |
Properti Gambar
Properti Gambar
| Nama | Jenis | Deskripsi |
|---|---|---|
| dynamicworld_algorithm_version | STRING | String versi yang mengidentifikasi secara unik model Dynamic World dan proses inferensi yang digunakan untuk menghasilkan gambar. |
| qa_algorithm_version | STRING | String versi yang mengidentifikasi secara unik proses penyamaran awan yang digunakan untuk menghasilkan gambar. |
Persyaratan Penggunaan
Persyaratan Penggunaan
Set data ini dilisensikan berdasarkan CC-BY 4.0 dan memerlukan atribusi berikut: "Set data ini dibuat untuk Project Dynamic World oleh Google bekerja sama dengan National Geographic Society dan World Resources Institute."
Berisi data Copernicus Sentinel yang dimodifikasi [2015-sekarang]. Lihat Pemberitahuan Hukum Data Sentinel.
Kutipan
Brown, C.F., Brumby, S.P., Guzder-Williams, B. et al. Dynamic World, Near real-time global 10 m land use land cover mapping. Sci Data 9, 251 (2022). doi:10.1038/s41597-022-01307-4
DOI
Mengeksplorasi dengan Earth Engine
Editor Kode (JavaScript)
// Construct a collection of corresponding Dynamic World and Sentinel-2 for
// inspection. Filter by region and date.
var START = ee.Date('2021-04-02');
var END = START.advance(1, 'day');

var colFilter = ee.Filter.and(
    ee.Filter.bounds(ee.Geometry.Point(20.6729, 52.4305)),
    ee.Filter.date(START, END));

var dwCol = ee.ImageCollection('GOOGLE/DYNAMICWORLD/V1').filter(colFilter);
var s2Col = ee.ImageCollection('COPERNICUS/S2_HARMONIZED');

// Link DW and S2 source images.
var linkedCol = dwCol.linkCollection(s2Col, s2Col.first().bandNames());

// Get example DW image with linked S2 image.
var linkedImg = ee.Image(linkedCol.first());

// Create a visualization that blends DW class label with probability.
// Define list pairs of DW LULC label and color.
var CLASS_NAMES = [
    'water', 'trees', 'grass', 'flooded_vegetation', 'crops',
    'shrub_and_scrub', 'built', 'bare', 'snow_and_ice'];

var VIS_PALETTE = [
    '419bdf', '397d49', '88b053', '7a87c6', 'e49635', 'dfc35a', 'c4281b',
    'a59b8f', 'b39fe1'];

// Create an RGB image of the label (most likely class) on [0, 1].
var dwRgb = linkedImg
    .select('label')
    .visualize({min: 0, max: 8, palette: VIS_PALETTE})
    .divide(255);

// Get the most likely class probability.
var top1Prob = linkedImg.select(CLASS_NAMES).reduce(ee.Reducer.max());

// Create a hillshade of the most likely class probability on [0, 1];
var top1ProbHillshade =
    ee.Terrain.hillshade(top1Prob.multiply(100))
    .divide(255);

// Combine the RGB image with the hillshade.
var dwRgbHillshade = dwRgb.multiply(top1ProbHillshade);

// Display the Dynamic World visualization with the source Sentinel-2 image.
Map.setCenter(20.6729, 52.4305, 12);
Map.addLayer(
    linkedImg, {min: 0, max: 3000, bands: ['B4', 'B3', 'B2']}, 'Sentinel-2 L1C');
Map.addLayer(
    dwRgbHillshade, {min: 0, max: 0.65}, 'Dynamic World V1 - label hillshade');
import ee
import geemap.core as geemap
Colab (Python)
# Construct a collection of corresponding Dynamic World and Sentinel-2 for
# inspection. Filter by region and date.
START = ee.Date('2021-04-02')
END = START.advance(1, 'day')

col_filter = ee.Filter.And(
    ee.Filter.bounds(ee.Geometry.Point(20.6729, 52.4305)),
    ee.Filter.date(START, END),
)

dw_col = ee.ImageCollection('GOOGLE/DYNAMICWORLD/V1').filter(col_filter)
s2_col = ee.ImageCollection('COPERNICUS/S2_HARMONIZED');

# Link DW and S2 source images.
linked_col = dw_col.linkCollection(s2_col, s2_col.first().bandNames());

# Get example DW image with linked S2 image.
linked_image = ee.Image(linked_col.first())

# Create a visualization that blends DW class label with probability.
# Define list pairs of DW LULC label and color.
CLASS_NAMES = [
    'water',
    'trees',
    'grass',
    'flooded_vegetation',
    'crops',
    'shrub_and_scrub',
    'built',
    'bare',
    'snow_and_ice',
]

VIS_PALETTE = [
    '419bdf',
    '397d49',
    '88b053',
    '7a87c6',
    'e49635',
    'dfc35a',
    'c4281b',
    'a59b8f',
    'b39fe1',
]

# Create an RGB image of the label (most likely class) on [0, 1].
dw_rgb = (
    linked_image.select('label')
    .visualize(min=0, max=8, palette=VIS_PALETTE)
    .divide(255)
)

# Get the most likely class probability.
top1_prob = linked_image.select(CLASS_NAMES).reduce(ee.Reducer.max())

# Create a hillshade of the most likely class probability on [0, 1]
top1_prob_hillshade = ee.Terrain.hillshade(top1_prob.multiply(100)).divide(255)

# Combine the RGB image with the hillshade.
dw_rgb_hillshade = dw_rgb.multiply(top1_prob_hillshade)

# Display the Dynamic World visualization with the source Sentinel-2 image.
m = geemap.Map()
m.set_center(20.6729, 52.4305, 12)
m.add_layer(
    linked_image,
    {'min': 0, 'max': 3000, 'bands': ['B4', 'B3', 'B2']},
    'Sentinel-2 L1C',
)
m.add_layer(
    dw_rgb_hillshade,
    {'min': 0, 'max': 0.65},
    'Dynamic World V1 - label hillshade',
)
m