Page Summary
-
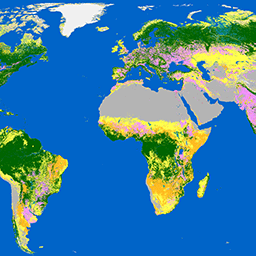
The ESA WorldCover 10 m 2020 product is a global land cover map at 10m resolution for 2020.
-
It is based on data from Sentinel-1 and Sentinel-2 satellites.
-
The product includes 11 distinct land cover classes.
-
This dataset was generated as part of the ESA WorldCover project within the EOEP-5 program.
-
The dataset is available from 2020-01-01 to 2021-01-01 and is licensed under CC-BY-4.0.
- Dataset Availability
- 2020-01-01T00:00:00Z–2021-01-01T00:00:00Z
- Dataset Producer
- ESA WorldCover Consortium
- Tags
Description
The European Space Agency (ESA) WorldCover 10 m 2020 product provides a global land cover map for 2020 at 10 m resolution based on Sentinel-1 and Sentinel-2 data. The WorldCover product comes with 11 land cover classes and has been generated in the framework of the ESA WorldCover project, part of the 5th Earth Observation Envelope Programme (EOEP-5) of the European Space Agency.
See also:
Bands
Bands
Pixel size: 10 meters (all bands)
| Name | Pixel Size | Description |
|---|---|---|
Map |
10 meters | Landcover class |
Map Class Table
| Value | Color | Description |
|---|---|---|
| 10 | #006400 | Tree cover |
| 20 | #ffbb22 | Shrubland |
| 30 | #ffff4c | Grassland |
| 40 | #f096ff | Cropland |
| 50 | #fa0000 | Built-up |
| 60 | #b4b4b4 | Bare / sparse vegetation |
| 70 | #f0f0f0 | Snow and ice |
| 80 | #0064c8 | Permanent water bodies |
| 90 | #0096a0 | Herbaceous wetland |
| 95 | #00cf75 | Mangroves |
| 100 | #fae6a0 | Moss and lichen |
Terms of Use
Terms of Use
Citations
Zanaga, D., Van De Kerchove, R., De Keersmaecker, W., Souverijns, N., Brockmann, C., Quast, R., Wevers, J., Grosu, A., Paccini, A., Vergnaud, S., Cartus, O., Santoro, M., Fritz, S., Georgieva, I., Lesiv, M., Carter, S., Herold, M., Li, Linlin, Tsendbazar, N.E., Ramoino, F., Arino, O., 2021. ESA WorldCover 10 m 2020 v100. (doi:10.5281/zenodo.5571936)
Explore with Earth Engine
Code Editor (JavaScript)
var dataset = ee.ImageCollection('ESA/WorldCover/v100').first();

var visualization = {
  bands: ['Map'],
};

Map.centerObject(dataset);

Map.addLayer(dataset, visualization, 'Landcover');
import ee
import geemap.core as geemap
Colab (Python)
dataset = ee.ImageCollection('ESA/WorldCover/v100').first()

visualization = {
    'bands': ['Map'],
}

m = geemap.Map()
m.center_object(dataset)
m.add_layer(dataset, visualization, 'Landcover')
m