Page Summary
-
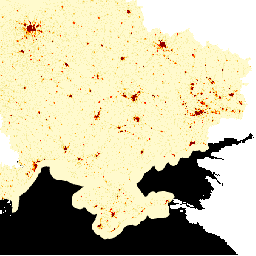
LandScan High Definition (HD) provides gridded population estimates at 3 arc-second (~100m) resolution for Ukraine in January 2022.
-
Each data cell represents an ambient (24 hour average) population count estimate, capturing the full potential activity space of people.
-
The dataset incorporates current land use and infrastructure data, facility occupancy estimates, and novel image processing algorithms.
-
Source data for subnational population counts is from the State Statistics Service of Ukraine, adjusted to the CIA World Factbook country total.
-
This dataset is licensed under CC-BY 4.0.
- Dataset Availability
- 2022-01-01T00:00:00Z–2022-02-01T00:00:00Z
- Dataset Producer
- Oak Ridge National Laboratory
- Tags
Description
LandScan High Definition (HD) provides gridded population estimates at 3 arc-second (~100m) resolution. Values for each LandScan HD cell represent an ambient (i.e. 24 hour average) population count estimate. In this way, the data capture the full potential activity space of people throughout the course of the day and night rather than just a residential location. The LandScan HD model incorporates current land use and infrastructure data from a variety of sources, applies facility occupancy estimates from ORNL's Population Density Tables (PDT) project, and leverages novel image processing algorithms developed at ORNL to rapidly map building structures and neighborhood areas using high-performance computing environments.
The source for subnational population counts used in the development of this data comes from State Statistics Service of Ukraine.
These subnational estimates were adjusted to the country total population provided by the CIA World Factbook.
Bands
Bands
Pixel size: 100 meters (all bands)
| Name | Min | Max | Pixel Size | Description |
|---|---|---|---|---|
population |
0* | 1020* | 100 meters | 24 hour average population count estimate |
Terms of Use
Terms of Use
This dataset is licensed under CC-BY 4.0.'
Explore with Earth Engine
Code Editor (JavaScript)
var dataset = ee.Image('DOE/ORNL/LandScan_HD/Ukraine_202201');
var vis = {
  min: 0.0,
  max: 10.0,
  palette: ['lemonchiffon', 'khaki', 'orange', 'orangered', 'red', 'maroon'],
};
Map.centerObject(dataset);
Map.addLayer(dataset, vis, 'Population Count');