- 利用可能なデータセットの期間
- 2019-01-01T00:00:00Z–2019-12-31T00:00:00Z
- データセット プロデューサー
- Biopama プログラム
- タグ
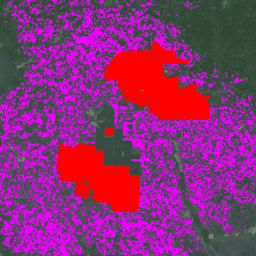
説明
このデータセットは、2019 年の 10 m の全球の工業用および小規模農家のパーム油マップです。アブラヤシ農園が検出された地域を対象としています。分類された画像は、Sentinel-1 と Sentinel-2 の半年間の合成画像に基づく畳み込みニューラル ネットワークの出力です。
詳しくは、こちらの記事をご覧ください。
バンド
バンド
ピクセルサイズ: 10 メートル(すべてのバンド)
| 名前 | ピクセルサイズ | 説明 |
|---|---|---|
classification |
10 メートル | アブラヤシのクラスの説明 |
分類クラス テーブル
| 値 | 色 | 説明 |
|---|---|---|
| 1 | #ff0000 | 工業的な閉鎖型キャノピーのパーム油プランテーション |
| 2 | #ef00ff | 小規模農家の閉鎖林冠型アブラヤシ農園 |
| 3 | #696969 | 閉鎖林冠のアブラヤシ以外の土地被覆または土地利用。 |
利用規約
利用規約
引用
引用:
Adrià, D.、Serge, W.、Erik, M.、David, G.、Stephen, P.、& Zoltan, S. (2021 年)。2019 年の高解像度グローバル産業および小規模農家のアブラヤシ マップ(バージョン v1)[データセット]。Zenodo. doi:10.5281/zenodo.4473715
DOI
Earth Engine で探索する
コードエディタ(JavaScript)
// Import the dataset; a collection of composite granules from 2019.
var dataset = ee.ImageCollection('BIOPAMA/GlobalOilPalm/v1');

// Select the classification band.
var opClass = dataset.select('classification');

// Mosaic all of the granules into a single image.
var mosaic = opClass.mosaic();

// Define visualization parameters.
var classificationVis = {
  min: 1,
  max: 3,
  palette: ['ff0000','ef00ff', '696969']
};

// Create a mask to add transparency to non-oil palm plantation class pixels.
var mask = mosaic.neq(3);
mask = mask.where(mask.eq(0), 0.6);

// Display the data on the map.
Map.addLayer(mosaic.updateMask(mask),
             classificationVis, 'Oil palm plantation type', true);
Map.setCenter(-3.0175, 5.2745,12);
import ee
import geemap.core as geemap
Colab(Python)
# Import the dataset a collection of composite granules from 2019.
dataset = ee.ImageCollection('BIOPAMA/GlobalOilPalm/v1')

# Select the classification band.
op_class = dataset.select('classification')

# Mosaic all of the granules into a single image.
mosaic = op_class.mosaic()

# Define visualization parameters.
classification_vis = {
    'min': 1,
    'max': 3,
    'palette': ['ff0000', 'ef00ff', '696969'],
}

# Create a mask to add transparency to non-oil palm plantation class pixels.
mask = mosaic.neq(3)
mask = mask.where(mask.eq(0), 0.6)

# Display the data on the map.
m = geemap.Map()
m.add_layer(
    mosaic.updateMask(mask),
    classification_vis,
    'Oil palm plantation type',
    True,
)
m.set_center(-3.0175, 5.2745, 12)
m