- Ketersediaan Set Data
- 2019-01-01T00:00:00Z–2019-12-31T00:00:00Z
- Produsen Set Data
- Biopama programme
- Tag
Deskripsi
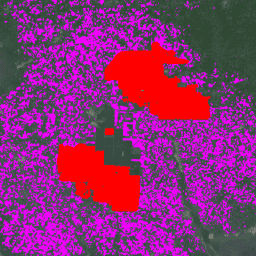
Set data ini adalah peta global industri dan perkebunan kelapa sawit skala kecil 10 m untuk tahun 2019. Set data ini mencakup area tempat perkebunan kelapa sawit terdeteksi. Gambar yang diklasifikasikan adalah output dari jaringan neural konvolusional berdasarkan komposit setengah tahun Sentinel-1 dan Sentinel-2.
Lihat artikel untuk mengetahui informasi tambahan.
Band
Band
Ukuran piksel: 10 meter (semua band)
| Nama | Ukuran Piksel | Deskripsi |
|---|---|---|
classification |
10 meter | Deskripsi class Kelapa Sawit |
Tabel Class klasifikasi
| Nilai | Warna | Deskripsi |
|---|---|---|
| 1 | #ff0000 | Perkebunan kelapa sawit industri dengan kanopi tertutup |
| 2 | #ef00ff | Perkebunan kelapa sawit skala kecil dengan kanopi tertutup |
| 3 | #696969 | Tutupan dan/atau penggunaan lahan lain yang bukan kelapa sawit dengan kanopi tertutup. |
Persyaratan Penggunaan
Persyaratan Penggunaan
Kutipan
Adrià, D., Serge, W., Erik, M., David, G., Stephen, P., &Zoltan, S. (2021). High resolution global industrial and smallholder oil palm map for 2019 (Version v1) [Data set]. Zenodo. doi:10.5281/zenodo.4473715
DOI
Mengeksplorasi dengan Earth Engine
Editor Kode (JavaScript)
// Import the dataset; a collection of composite granules from 2019.
var dataset = ee.ImageCollection('BIOPAMA/GlobalOilPalm/v1');

// Select the classification band.
var opClass = dataset.select('classification');

// Mosaic all of the granules into a single image.
var mosaic = opClass.mosaic();

// Define visualization parameters.
var classificationVis = {
  min: 1,
  max: 3,
  palette: ['ff0000','ef00ff', '696969']
};

// Create a mask to add transparency to non-oil palm plantation class pixels.
var mask = mosaic.neq(3);
mask = mask.where(mask.eq(0), 0.6);

// Display the data on the map.
Map.addLayer(mosaic.updateMask(mask),
             classificationVis, 'Oil palm plantation type', true);
Map.setCenter(-3.0175, 5.2745,12);
import ee
import geemap.core as geemap
Colab (Python)
# Import the dataset a collection of composite granules from 2019.
dataset = ee.ImageCollection('BIOPAMA/GlobalOilPalm/v1')

# Select the classification band.
op_class = dataset.select('classification')

# Mosaic all of the granules into a single image.
mosaic = op_class.mosaic()

# Define visualization parameters.
classification_vis = {
    'min': 1,
    'max': 3,
    'palette': ['ff0000', 'ef00ff', '696969'],
}

# Create a mask to add transparency to non-oil palm plantation class pixels.
mask = mosaic.neq(3)
mask = mask.where(mask.eq(0), 0.6)

# Display the data on the map.
m = geemap.Map()
m.add_layer(
    mosaic.updateMask(mask),
    classification_vis,
    'Oil palm plantation type',
    True,
)
m.set_center(-3.0175, 5.2745, 12)
m