- डेटासेट की उपलब्धता
- 2019-01-01T00:00:00Z–2019-12-31T00:00:00Z
- डेटासेट प्रोड्यूसर
- Biopama programme
- टैग
ब्यौरा
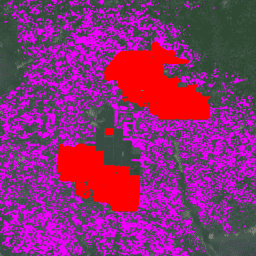
यह डेटासेट, साल 2019 के लिए 10 मीटर का ग्लोबल इंडस्ट्रियल और छोटे किसानों के पाम ऑयल का मैप है. इसमें उन इलाकों को शामिल किया गया है जहां पाम ऑयल के बागान पाए गए हैं. क्लासिफ़ाइड इमेज, Sentinel-1 और Sentinel-2 के छह महीने के कंपोज़िट के आधार पर, कनवोल्यूशनल न्यूरल नेटवर्क का आउटपुट होती हैं.
ज़्यादा जानकारी के लिए, लेख देखें.
बैंड
बैंड
पिक्सल का साइज़: 10 मीटर (सभी बैंड)
| नाम | पिक्सल का साइज़ | ब्यौरा |
|---|---|---|
classification |
10 मीटर | पाम ऑइल (ताड़ का तेल) की क्लास का ब्यौरा |
कैटगरी के हिसाब से क्लास टेबल
| मान | रंग | ब्यौरा |
|---|---|---|
| 1 | #ff0000 | इंडस्ट्रियल क्लोज़्ड-कैनोपी ऑयल पाम प्लांटेशन |
| 2 | #ef00ff | छोटे किसानों के पाम ऑयल के बागान, जिनमें कैनोपी बंद है |
| 3 | #696969 | अन्य ज़मीनें और/या इस्तेमाल की जाने वाली ऐसी जगहें जहां पाम ऑइल के पेड़ नहीं हैं. |
इस्तेमाल की शर्तें
इस्तेमाल की शर्तें
उद्धरण
डिएगो एड्रिया, सर्गे, डब्ल्यू॰, एरिक, एम॰, डेविड, जी॰, स्टीफ़न, पी., & Zoltan, S. (2021). साल 2019 के लिए, हाई रिज़ॉल्यूशन वाला ग्लोबल इंडस्ट्रियल और छोटे किसानों के पाम ऑयल का मैप (वर्शन v1) [डेटा सेट]. Zenodo. doi:10.5281/zenodo.4473715
डीओआई
Earth Engine की मदद से एक्सप्लोर करें
कोड एडिटर (JavaScript)
// Import the dataset; a collection of composite granules from 2019.
var dataset = ee.ImageCollection('BIOPAMA/GlobalOilPalm/v1');

// Select the classification band.
var opClass = dataset.select('classification');

// Mosaic all of the granules into a single image.
var mosaic = opClass.mosaic();

// Define visualization parameters.
var classificationVis = {
  min: 1,
  max: 3,
  palette: ['ff0000','ef00ff', '696969']
};

// Create a mask to add transparency to non-oil palm plantation class pixels.
var mask = mosaic.neq(3);
mask = mask.where(mask.eq(0), 0.6);

// Display the data on the map.
Map.addLayer(mosaic.updateMask(mask),
             classificationVis, 'Oil palm plantation type', true);
Map.setCenter(-3.0175, 5.2745,12);
import ee
import geemap.core as geemap
Colab (Python)
# Import the dataset a collection of composite granules from 2019.
dataset = ee.ImageCollection('BIOPAMA/GlobalOilPalm/v1')

# Select the classification band.
op_class = dataset.select('classification')

# Mosaic all of the granules into a single image.
mosaic = op_class.mosaic()

# Define visualization parameters.
classification_vis = {
    'min': 1,
    'max': 3,
    'palette': ['ff0000', 'ef00ff', '696969'],
}

# Create a mask to add transparency to non-oil palm plantation class pixels.
mask = mosaic.neq(3)
mask = mask.where(mask.eq(0), 0.6)

# Display the data on the map.
m = geemap.Map()
m.add_layer(
    mosaic.updateMask(mask),
    classification_vis,
    'Oil palm plantation type',
    True,
)
m.set_center(-3.0175, 5.2745, 12)
m