
توضِّح هذه الصفحة كيفية أخذ الرسوم البيانية الحالية من "جداول بيانات Google" وإضافتها إلى عروض "العروض التقديمية من Google".
يمكن أن تساعد إضافة الرسوم البيانية إلى عرض تقديمي في إحداث تأثير أكبر وجعل البيانات ذات معنى لجمهورك. الرسوم البيانية هي أدوات قوية بشكل فريد لعرض الأنماط أو الاتجاهات في مجموعة بيانات، ويمكن أن تساعدك في التواصل بوضوح بشأن البيانات الكمية.
يناقش الفيديو أعلاه كيفية إنشاء شرائح من بيانات جدول البيانات. ويتضمّن مثالاً كاملاً (Python) يضيف رسمًا بيانيًا إلى شريحة، ويستورد أيضًا بيانات خلايا جدول البيانات إلى جدول.
لمحة عن إضافة الرسوم البيانية
عند تقديم معلومات كمية، يمكن أن تعزّز الرسوم البيانية للبيانات عرضك التقديمي. تتيح لك واجهة برمجة التطبيقات Slides API تضمين أي رسم بياني يمكنك إنشاؤه في "جداول بيانات Google": الرسوم البيانية الشريطية والخطية والدائرية وغيرها.
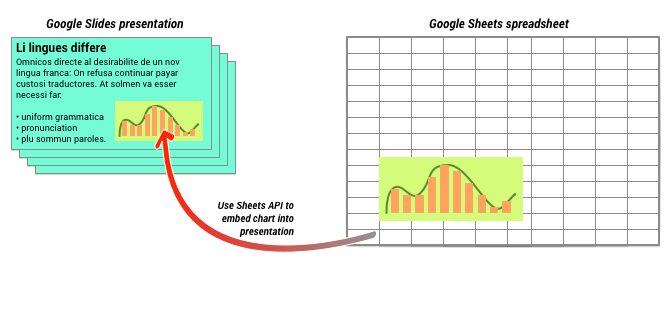
كما هو موضّح في المخطّط البياني أعلاه، عليك أولاً إنشاء رسم بياني في "جداول بيانات Google". بعد إنشاء الرسم البياني، يمكنك تضمينه في عرضك التقديمي.
في ما يلي العملية العامة لإدارة الرسوم البيانية في عرضك التقديمي:
- إنشاء رسم بياني في "جداول بيانات Google"
- استخدام واجهة برمجة التطبيقات Sheets API لقراءة رقم تعريف الرسم البياني لـ EmbeddedChart الناتج
- استخدام CreateSheetsChartRequest مرة واحدة لإضافته إلى شريحة
- استخدام RefreshSheetsChartRequest حسب الحاجة لمزامنته مع البيانات المصدر
الرسوم البيانية الثابتة مقابل الرسوم البيانية المرتبطة
عند استخدام واجهة برمجة التطبيقات لإضافة رسم بياني إلى عرضك التقديمي، يكون أحد المعلمات التي تحدّدها هو LinkingMode. يحدّد هذا ما إذا كان سيتم إضافة الرسم البياني كصورة ثابتة أو ككائن يمكن إعادة تحميله في المستقبل.
استخدِم الوضع LINKED في الحالات التالية:
- إذا أردت إعادة تحميل الرسم البياني في المستقبل، ما يعكس التغييرات في البيانات الأساسية
- إذا أردت أن يحصل المتعاونون على رابط يؤدي إلى جدول البيانات الذي يحتوي على الرسم البياني المصدر
استخدِم الوضع NOT_LINKED_IMAGE (ثابت) في الحالات التالية:
- إذا أردت ألا يتغيّر الرسم البياني أبدًا في المستقبل
- إذا أردت ألا يرى المتعاونون رابطًا يؤدي إلى جدول البيانات المصدر
نطاقات الوصول إلى "جداول بيانات Google"
عند إضافة رسم بياني إلى شريحتك، تحتاج واجهة برمجة التطبيقات Slides API إلى الوصول إليه في "جداول بيانات Google". يعني ذلك أنّ طلبك يجب أن يستخدم أحد النطاقات التالية:
https://www.googleapis.com/auth/spreadsheets.readonly(مفضّل)https://www.googleapis.com/auth/spreadsheetshttps://www.googleapis.com/auth/drive.readonlyhttps://www.googleapis.com/auth/drive
إنّ النطاق spreadsheets.readonly هو الأفضل بشكل عام، لأنّه الأكثر تقييدًا. ومع ذلك، إذا كان تطبيقك يستخدم حاليًا أحد النطاقات الأخرى المدرَجة أعلاه، فما عليك سوى استخدام هذا النطاق.
إضافة رسم بياني
لإضافة رسم بياني، عليك معرفة رقم تعريف جدول البيانات ورقم تعريف الرسم البياني في "جداول بيانات Google". بعد ذلك، يمكنك استدعاء طريقة batchUpdate، باستخدام
CreateSheetsChartRequest
مرة واحدة لإضافة الرسم البياني.
يأخذ المثال التالي رسمًا بيانيًا ويضيفه إلى شريحة كـ LINKED حتى يمكن إعادة تحميله لاحقًا.
برمجة التطبيقات
انتقال
جافا
JavaScript
Node.js
PHP
Python
Ruby
إعادة تحميل رسم بياني
إذا تضمّنت عرضك التقديمي رسمًا بيانيًا LINKED، يمكنك إعادة تحميله
في أي وقت باستخدام
RefreshSheetsChartRequest.
يؤدي ذلك إلى تعديل الرسم البياني لمزامنته مع الرسم البياني والبيانات الأساسية في "جداول بيانات Google" التي يستند إليها.
يعيد المثال التالي تحميل رسم بياني حالي: