Aggiungere grafici alle diapositive

In questa pagina viene descritto come acquisire grafici esistenti da Fogli Google e aggiungerli alle presentazioni di Presentazioni Google.

L'aggiunta di grafici a una presentazione può contribuire ad avere un impatto maggiore e a rendere i dati significativi per il tuo pubblico. I grafici sono strumenti straordinariamente potenti per mostrare pattern o tendenze in un set di dati e possono aiutarti a comunicare chiaramente i dati quantitativi.

Il video sopra riportato illustra come generare slide dai dati di un foglio di lavoro. Include un esempio completo (Python) che consente di aggiungere un grafico a una diapositiva e di importare i dati delle celle del foglio di lavoro in una tabella.

Informazioni sull'aggiunta di grafici

Ogni volta che presenti informazioni quantitative, i grafici di dati possono migliorare la presentazione. L'API Presentazioni ti consente di includere qualsiasi grafico che puoi creare in Fogli Google: grafici a barre, grafici a linee, grafici a torta e molti altri.

concetto di aggiunta di un grafico di Fogli Google a una presentazione dell'API Presentazioni

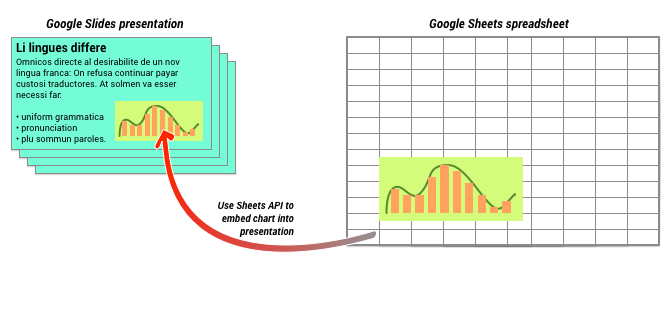
Come mostrato nel diagramma sopra, devi prima creare il grafico in Fogli Google. Una volta creato il grafico, puoi incorporarlo nella presentazione.

La procedura generale per la gestione dei grafici nella tua presentazione è la seguente:

  1. Crea un grafico in Fogli Google.
  2. Utilizza l'API Fogli per leggere l'ID del grafico risultante EmbeddedChart.
  3. Usa una volta CreateSheetsChartRequest per aggiungerlo a una diapositiva.
  4. Utilizza RefreshSheetsChartRequest come necessario per sincronizzarlo con i dati di origine.

Grafici statici e collegati

Quando utilizzi l'API per aggiungere un grafico alla presentazione, un parametro specificato è LinkingMode. Questo determina se il grafico viene aggiunto come immagine statica o come oggetto che può essere aggiornato in futuro.

Usa la modalità LINKED se:

  • In futuro vuoi aggiornare il grafico per riflettere le modifiche ai dati sottostanti.
  • Vuoi che i collaboratori dispongano di un link al foglio di lavoro contenente il grafico di origine.

Usa la modalità NOT_LINKED_IMAGE (statica) se:

  • Il tuo obiettivo è fare in modo che il grafico non cambi mai in futuro.
  • Non vuoi che i collaboratori vedano un link al foglio di lavoro di origine.

Ambiti per l'accesso a Fogli Google

Quando aggiungi un grafico alla diapositiva, l'API Presentazioni deve accedere al grafico in Fogli Google. Ciò significa che la richiesta deve utilizzare uno dei seguenti ambiti:

  • https://www.googleapis.com/auth/spreadsheets.readonly (preferito)
  • https://www.googleapis.com/auth/spreadsheets
  • https://www.googleapis.com/auth/drive.readonly
  • https://www.googleapis.com/auth/drive

L'ambito spreadsheets.readonly è in genere il migliore da utilizzare, perché è il più restrittivo. Tuttavia, se la tua app utilizza già uno degli altri ambiti elencati in precedenza, puoi utilizzare questo ambito.

Aggiunta di un grafico

Per aggiungere un grafico, devi conoscere l'ID foglio di lavoro e l'ID del grafico in Fogli Google. Quindi, chiama il metodo batchUpdate, utilizzando CreateSheetsChartRequest una volta per aggiungere il grafico.

L'esempio seguente acquisisce un grafico e lo aggiunge a una slide come LINKED in modo che possa essere aggiornato in un secondo momento.

Apps Script

slides/api/Snippets.gs
/**
 * Embed a Sheets chart (indicated by the spreadsheetId and sheetChartId) onto
 *   a page in the presentation. Setting the linking mode as 'LINKED' allows the
 *   chart to be refreshed if the Sheets version is updated.
 * @param {string} presentationId
 * @param {string} pageId
 * @param {string} shapeId
 * @param {string} sheetChartId
 * @returns {*}
 */
function createSheetsChart(presentationId, pageId, shapeId, sheetChartId) {
  const emu4M = {
    magnitude: 4000000,
    unit: 'EMU'
  };
  const presentationChartId = 'MyEmbeddedChart';
  const requests = [{
    createSheetsChart: {
      objectId: presentationChartId,
      spreadsheetId: shapeId,
      chartId: sheetChartId,
      linkingMode: 'LINKED',
      elementProperties: {
        pageObjectId: pageId,
        size: {
          height: emu4M,
          width: emu4M
        },
        transform: {
          scaleX: 1,
          scaleY: 1,
          translateX: 100000,
          translateY: 100000,
          unit: 'EMU'
        }
      }
    }
  }];

  // Execute the request.
  try {
    const batchUpdateResponse = Slides.Presentations.batchUpdate({
      requests: requests
    }, presentationId);
    console.log('Added a linked Sheets chart with ID: %s', presentationChartId);

    return batchUpdateResponse;
  } catch (err) {
    // TODO (Developer) - Handle exception
    console.log('Failed with error: %s', err.error);
  }
};

Go

slide/snippets/presentations.go
// Embed a Sheets chart (indicated by the spreadsheetId and sheetChartId) onto
// a page in the presentation. Setting the linking mode as "LINKED" allows the
// chart to be refreshed if the Sheets version is updated.
emu4M := slides.Dimension{Magnitude: 4000000, Unit: "EMU"}
presentationChartId := "MyEmbeddedChart"
requests := []*slides.Request{{
	CreateSheetsChart: &slides.CreateSheetsChartRequest{
		ObjectId:      presentationChartId,
		SpreadsheetId: spreadsheetId,
		ChartId:       sheetChartId,
		LinkingMode:   "LINKED",
		ElementProperties: &slides.PageElementProperties{
			PageObjectId: pageId,
			Size: &slides.Size{
				Height: &emu4M,
				Width:  &emu4M,
			},
			Transform: &slides.AffineTransform{
				ScaleX:     1.0,
				ScaleY:     1.0,
				TranslateX: 100000.0,
				TranslateY: 100000.0,
				Unit:       "EMU",
			},
		},
	},
}}

// Execute the requests.
body := &slides.BatchUpdatePresentationRequest{Requests: requests}
response, _ := slidesService.Presentations.BatchUpdate(presentationId, body).Do()
fmt.Printf("Added a linked Sheets chart with ID %s", presentationChartId)

Java

slides/snippets/src/main/java/CreateSheetsChart.java
import com.google.api.client.googleapis.json.GoogleJsonError;
import com.google.api.client.googleapis.json.GoogleJsonResponseException;
import com.google.api.client.http.HttpRequestInitializer;
import com.google.api.client.http.javanet.NetHttpTransport;
import com.google.api.client.json.gson.GsonFactory;
import com.google.api.services.slides.v1.Slides;
import com.google.api.services.slides.v1.SlidesScopes;
import com.google.api.services.slides.v1.model.AffineTransform;
import com.google.api.services.slides.v1.model.BatchUpdatePresentationRequest;
import com.google.api.services.slides.v1.model.BatchUpdatePresentationResponse;
import com.google.api.services.slides.v1.model.CreateSheetsChartRequest;
import com.google.api.services.slides.v1.model.Dimension;
import com.google.api.services.slides.v1.model.PageElementProperties;
import com.google.api.services.slides.v1.model.Request;
import com.google.api.services.slides.v1.model.Size;
import com.google.auth.http.HttpCredentialsAdapter;
import com.google.auth.oauth2.GoogleCredentials;

import java.io.IOException;
import java.util.ArrayList;
import java.util.Collections;
import java.util.List;

/* Class to demonstrate the use of Slides Create Chart API */
public class CreateSheetsChart {
  /**
   * Adds chart from spreadsheet to slides as linked.
   *
   * @param presentationId - id of the presentation.
   * @param pageId         - id of the page.
   * @param spreadsheetId  - id of the spreadsheet.
   * @param sheetChartId   - id of the chart in sheets.
   * @return presentation chart id
   * @throws IOException - if credentials file not found.
   */
  public static BatchUpdatePresentationResponse createSheetsChart(
      String presentationId, String pageId, String spreadsheetId, Integer sheetChartId)
      throws IOException {
        /* Load pre-authorized user credentials from the environment.
           TODO(developer) - See https://developers.google.com/identity for
            guides on implementing OAuth2 for your application. */
    GoogleCredentials credentials = GoogleCredentials.getApplicationDefault()
        .createScoped(Collections.singleton(SlidesScopes.PRESENTATIONS));
    HttpRequestInitializer requestInitializer = new HttpCredentialsAdapter(
        credentials);

    // Create the slides API client
    Slides service = new Slides.Builder(new NetHttpTransport(),
        GsonFactory.getDefaultInstance(),
        requestInitializer)
        .setApplicationName("Slides samples")
        .build();

    // Embed a Sheets chart (indicated by the spreadsheetId and sheetChartId) onto
    // a page in the presentation. Setting the linking mode as "LINKED" allows the
    // chart to be refreshed if the Sheets version is updated.
    List<Request> requests = new ArrayList<>();
    Dimension emu4M = new Dimension().setMagnitude(4000000.0).setUnit("EMU");
    String presentationChartId = "MyEmbeddedChart";
    requests.add(new Request()
        .setCreateSheetsChart(new CreateSheetsChartRequest()
            .setObjectId(presentationChartId)
            .setSpreadsheetId(spreadsheetId)
            .setChartId(sheetChartId)
            .setLinkingMode("LINKED")
            .setElementProperties(new PageElementProperties()
                .setPageObjectId(pageId)
                .setSize(new Size()
                    .setHeight(emu4M)
                    .setWidth(emu4M))
                .setTransform(new AffineTransform()
                    .setScaleX(1.0)
                    .setScaleY(1.0)
                    .setTranslateX(100000.0)
                    .setTranslateY(100000.0)
                    .setUnit("EMU")))));

    BatchUpdatePresentationResponse response = null;
    try {
      // Execute the request.
      BatchUpdatePresentationRequest body =
          new BatchUpdatePresentationRequest().setRequests(requests);
      response = service.presentations().batchUpdate(presentationId, body).execute();
      System.out.println("Added a linked Sheets chart with ID " + presentationChartId);
    } catch (GoogleJsonResponseException e) {
      // TODO(developer) - handle error appropriately
      GoogleJsonError error = e.getDetails();
      if (error.getCode() == 404) {
        System.out.printf("Presentation not found with id '%s'.\n", presentationId);
      } else {
        throw e;
      }
    }
    return response;
  }
}

JavaScript

slides/snippets/slides_create_sheets_chart.js
function createSheetsChart(presentationId, pageId, shapeId, sheetChartId, callback) {
  // Embed a Sheets chart (indicated by the spreadsheetId and sheetChartId) onto
  // a page in the presentation. Setting the linking mode as "LINKED" allows the
  // chart to be refreshed if the Sheets version is updated.
  const emu4M = {
    magnitude: 4000000,
    unit: 'EMU',
  };
  const presentationChartId = 'MyEmbeddedChart';
  const requests = [{
    createSheetsChart: {
      objectId: presentationChartId,
      spreadsheetId: shapeId,
      chartId: sheetChartId,
      linkingMode: 'LINKED',
      elementProperties: {
        pageObjectId: pageId,
        size: {
          height: emu4M,
          width: emu4M,
        },
        transform: {
          scaleX: 1,
          scaleY: 1,
          translateX: 100000,
          translateY: 100000,
          unit: 'EMU',
        },
      },
    },
  }];
  // Execute the request.
  try {
    gapi.client.slides.presentations.batchUpdate({
      presentationId: presentationId,
      requests: requests,
    }).then((batchUpdateResponse) => {
      console.log(`Added a linked Sheets chart with ID: ${presentationChartId}`);
      if (callback) callback(batchUpdateResponse.result);
    });
  } catch (err) {
    document.getElementById('content').innerText = err.message;
    return;
  }
}

Node.js

slides/snippets/slides_create_sheets_chart.js
/**
 * Embeds a Sheets chart onto a page in a presentation.
 * @param {string} presentationId The presentation ID.
 * @param {string} pageId The page ID.
 * @param {string} spreadsheetId The spreadsheet ID.
 * @param {string} sheetChartId The sheet's chart ID.
 */
async function createSheetsChart(
    presentationId,
    pageId,
    spreadsheetId,
    sheetChartId,
) {
  const {GoogleAuth} = require('google-auth-library');
  const {google} = require('googleapis');

  const auth = new GoogleAuth({
    scopes: 'https://www.googleapis.com/auth/presentations',
  });

  const service = google.slides({version: 'v1', auth});

  // Embed a Sheets chart (indicated by the spreadsheetId and sheetChartId) onto
  // a page in the presentation. Setting the linking mode as "LINKED" allows the
  // chart to be refreshed if the Sheets version is updated.
  const emu4M = {
    magnitude: 4000000,
    unit: 'EMU',
  };
  const presentationChartId = 'MyEmbeddedChart';
  const requests = [
    {
      createSheetsChart: {
        objectId: presentationChartId,
        spreadsheetId: spreadsheetId,
        chartId: sheetChartId,
        linkingMode: 'LINKED',
        elementProperties: {
          pageObjectId: pageId,
          size: {
            height: emu4M,
            width: emu4M,
          },
          transform: {
            scaleX: 1,
            scaleY: 1,
            translateX: 100000,
            translateY: 100000,
            unit: 'EMU',
          },
        },
      },
    },
  ];

  // Execute the request.
  try {
    const batchUpdateResponse = await service.presentations.batchUpdate({
      presentationId,
      resource: {
        requests,
      },
    });
    console.log(`Added a linked Sheets chart with ID: ${presentationChartId}`);
    return batchUpdateResponse.data;
  } catch (err) {
    // TODO (developer) - Handle exception
    throw err;
  }
}

PHP

slides/snippets/src/SlidesCreateSheetsChart.php
use Google\Client;
use Google\Service\Drive;
use Google\Service\Slides;
use Google\Service\Slides\Request;


function createSheetsChart($presentationId, $pageId, $spreadsheetId, $sheetChartId)
{
    /* Load pre-authorized user credentials from the environment.
       TODO(developer) - See https://developers.google.com/identity for
        guides on implementing OAuth2 for your application. */
    $client = new Google\Client();
    $client->useApplicationDefaultCredentials();
    $client->addScope(Google\Service\Drive::DRIVE);
    $slidesService = new Google_Service_Slides($client);
    // Embed a Sheets chart (indicated by the spreadsheet_id and sheet_chart_id) onto
    // a page in the presentation. Setting the linking mode as "LINKED" allows the
    // chart to be refreshed if the Sheets version is updated.
    try {
        //creating new presentaion chart
        $presentationChartId = 'MyEmbeddedChart';
        $emu4M = array('magnitude' => 4000000, 'unit' => 'EMU');
        $requests = array();
        $requests[] = new Google_Service_Slides_Request(
            array(
                'createSheetsChart' => array(
                    'spreadsheetId' => $spreadsheetId,
                    'chartId' => $sheetChartId,
                    'linkingMode' => 'LINKED',
                    'elementProperties' => array(
                        'pageObjectId' => $pageId,
                        'size' => array(
                            'height' => $emu4M,
                            'width' => $emu4M
                        ),
                        'transform' => array(
                            'scaleX' => 1,
                            'scaleY' => 1,
                            'translateX' => 100000,
                            'translateY' => 100000,
                            'unit' => 'EMU'
                        )
                    )
                )
            ));

        // Execute the request.
        $batchUpdateRequest = new Google_Service_Slides_BatchUpdatePresentationRequest(array(
            'requests' => $requests
        ));
        $response = $slidesService->presentations->batchUpdate($presentationId, $batchUpdateRequest);
        printf("Added a linked Sheets chart with ID: %s\n", $response->getPresentationId());
        return $response;
    } catch (Exception $e) {
        echo 'Message: ' . $e->getMessage();
    }
}

Python

slides/snippets/slides_create_sheets_chart.py
import google.auth
from googleapiclient.discovery import build
from googleapiclient.errors import HttpError


def create_sheets_chart(
    presentation_id, page_id, spreadsheet_id, sheet_chart_id
):
  """
  create_sheets_chart the user has access to.
  Load pre-authorized user credentials from the environment.
  TODO(developer) - See https://developers.google.com/identity
  for guides on implementing OAuth2 for the application.
  """
  creds, _ = google.auth.default()
  # pylint: disable=maybe-no-member
  try:
    slides_service = build("slides", "v1", credentials=creds)
    # Embed a Sheets chart (indicated by the spreadsheet_id and
    # sheet_chart_id) onto a page in the presentation.
    # Setting the linking mode as "LINKED" allows the
    # chart to be refreshed if the Sheets version is updated.

    emu4m = {"magnitude": 4000000, "unit": "EMU"}

    presentation_chart_id = "MyEmbeddedChart"
    requests = [
        {
            "createSheetsChart": {
                "objectId": presentation_chart_id,
                "spreadsheetId": spreadsheet_id,
                "chartId": sheet_chart_id,
                "linkingMode": "LINKED",
                "elementProperties": {
                    "pageObjectId": page_id,
                    "size": {"height": emu4m, "width": emu4m},
                    "transform": {
                        "scaleX": 1,
                        "scaleY": 1,
                        "translateX": 100000,
                        "translateY": 100000,
                        "unit": "EMU",
                    },
                },
            }
        }
    ]

    # Execute the request.
    body = {"requests": requests}
    response = (
        slides_service.presentations()
        .batchUpdate(presentationId=presentation_id, body=body)
        .execute()
    )
    print(f"Added a linked Sheets chart with ID: {presentation_chart_id}")
    return response
  except HttpError as error:
    print(f"An error occurred: {error}")
    return error


if __name__ == "__main__":
  # Put the presentation_id, Page_id of slides
  # spreadsheet_id and sheet_chart_id to be submitted.
  create_sheets_chart(
      "10QnVUx1X2qHsL17WUidGpPh_SQhXYx40CgIxaKk8jU4",
      "FIRSTSLIDE",
      "17eqFZl_WK4WVixX8PjvjfLD77DraoFwMDXeiHB3dvuM",
      "1107320627",
  )

Ruby

slides/snippets/lib/file_snippets.rb
# Embed a Sheets chart (indicated by the spreadsheet_id and sheet_chart_id) onto
# a page in the presentation. Setting the linking mode as "LINKED" allows the
# chart to be refreshed if the Sheets version is updated.
emu4M = {
  magnitude: 4000000,
  unit:      'EMU'
}
presentation_chart_id = 'my_embedded_chart'
requests = [{
  create_sheets_chart: {
    object_id_prop:     presentation_chart_id,
    spreadsheet_id:     spreadsheet_id,
    chart_id:           sheet_chart_id,
    linking_mode:       'LINKED',
    element_properties: {
      page_object_id: page_id,
      size:           {
        height: emu4M,
        width:  emu4M
      },
      transform:      {
        scale_x:     1,
        scale_y:     1,
        translate_x: 100000,
        translate_y: 100000,
        unit:        'EMU'
      }
    }
  }
}]

# Execute the request.
req = Google::Apis::SlidesV1::BatchUpdatePresentationRequest.new(requests: requests)
response = slides_service.batch_update_presentation(presentation_id, req)

puts "Added a linked Sheets chart with ID: #{presentation_chart_id}"

Aggiornamento di un grafico

Se hai incorporato un grafico LINKED nella presentazione, puoi aggiornarlo in qualsiasi momento utilizzando RefreshSheetsChartRequest. In questo modo il grafico viene aggiornato per sincronizzarlo con il grafico sottostante di Fogli e i dati su cui è basato.

L'esempio seguente aggiorna un grafico esistente:

Apps Script

slides/api/Snippets.gs
/**
 * Refresh the sheets charts
 * @param {string} presentationId
 * @param {string} presentationChartId
 * @returns {*}
 */
function refreshSheetsChart(presentationId, presentationChartId) {
  const requests = [{
    refreshSheetsChart: {
      objectId: presentationChartId
    }
  }];

  // Execute the request.
  try {
    const batchUpdateResponse = Slides.Presentations.batchUpdate({
      requests: requests
    }, presentationId);
    console.log('Refreshed a linked Sheets chart with ID: %s', presentationChartId);

    return batchUpdateResponse;
  } catch (err) {
    // TODO (Developer) - Handle exception
    console.log('Failed with error: %s', err.error);
  }
};

Go

slide/snippets/presentations.go
requests := []*slides.Request{{
	RefreshSheetsChart: &slides.RefreshSheetsChartRequest{
		ObjectId: presentationChartId,
	},
}}

// Execute the requests.
body := &slides.BatchUpdatePresentationRequest{Requests: requests}
response, _ := slidesService.Presentations.BatchUpdate(presentationId, body).Do()
fmt.Printf("Refreshed a linked Sheets chart with ID %s", presentationChartId)

Java

slides/snippets/src/main/java/RefreshSheetsChart.java
import com.google.api.client.googleapis.json.GoogleJsonError;
import com.google.api.client.googleapis.json.GoogleJsonResponseException;
import com.google.api.client.http.HttpRequestInitializer;
import com.google.api.client.http.javanet.NetHttpTransport;
import com.google.api.client.json.gson.GsonFactory;
import com.google.api.services.slides.v1.Slides;
import com.google.api.services.slides.v1.SlidesScopes;
import com.google.api.services.slides.v1.model.BatchUpdatePresentationRequest;
import com.google.api.services.slides.v1.model.BatchUpdatePresentationResponse;
import com.google.api.services.slides.v1.model.RefreshSheetsChartRequest;
import com.google.api.services.slides.v1.model.Request;
import com.google.auth.http.HttpCredentialsAdapter;
import com.google.auth.oauth2.GoogleCredentials;

import java.io.IOException;
import java.util.ArrayList;
import java.util.Collections;
import java.util.List;

/* Class to demonstrate the use of Slides Refresh Chart API */
public class RefreshSheetsChart {
  /**
   * Refresh the sheets charts.
   *
   * @param presentationId      - id of the presentation.
   * @param presentationChartId - id of the presentation chart.
   * @return presentation chart id
   * @throws IOException - if credentials file not found.
   */
  public static BatchUpdatePresentationResponse refreshSheetsChart(
      String presentationId, String presentationChartId) throws IOException {
        /* Load pre-authorized user credentials from the environment.
           TODO(developer) - See https://developers.google.com/identity for
            guides on implementing OAuth2 for your application. */
    GoogleCredentials credentials = GoogleCredentials.getApplicationDefault()
        .createScoped(Collections.singleton(SlidesScopes.PRESENTATIONS));
    HttpRequestInitializer requestInitializer = new HttpCredentialsAdapter(
        credentials);

    // Create the slides API client
    Slides service = new Slides.Builder(new NetHttpTransport(),
        GsonFactory.getDefaultInstance(),
        requestInitializer)
        .setApplicationName("Slides samples")
        .build();

    List<Request> requests = new ArrayList<>();

    // Refresh an existing linked Sheets chart embedded a presentation.
    requests.add(new Request()
        .setRefreshSheetsChart(new RefreshSheetsChartRequest()
            .setObjectId(presentationChartId)));

    BatchUpdatePresentationResponse response = null;
    try {
      // Execute the request.
      BatchUpdatePresentationRequest body =
          new BatchUpdatePresentationRequest().setRequests(requests);
      response = service.presentations().batchUpdate(presentationId, body).execute();
      System.out.println("Refreshed a linked Sheets chart with ID " + presentationChartId);
    } catch (GoogleJsonResponseException e) {
      // TODO(developer) - handle error appropriately
      GoogleJsonError error = e.getDetails();
      if (error.getCode() == 400) {
        System.out.printf("Presentation chart not found with id '%s'.\n", presentationChartId);
      } else if (error.getCode() == 404) {
        System.out.printf("Presentation not found with id '%s'.\n", presentationId);
      } else {
        throw e;
      }
    }
    return response;
  }
}

JavaScript

slides/snippets/slides_refresh_sheets_chart.js
function refreshSheetsChart(presentationId, presentationChartId, callback) {
  const requests = [{
    refreshSheetsChart: {
      objectId: presentationChartId,
    },
  }];
  // Execute the request.
  try {
    gapi.client.slides.presentations.batchUpdate({
      presentationId: presentationId,
      requests: requests,
    }).then((batchUpdateResponse) => {
      console.log(`Refreshed a linked Sheets chart with ID: ${presentationChartId}`);
      if (callback) callback(batchUpdateResponse.result);
    });
  } catch (err) {
    document.getElementById('content').innerText = err.message;
    return;
  }
}

Node.js

slides/snippets/slides_refresh_sheets_chart.js
/**
 * Refreshes an embedded sheet chart.
 * @param {string} presentationId The presentation ID.
 * @param {string} presentationChartId The presentation's chart ID.
 */
async function refreshSheetsChart(presentationId, presentationChartId) {
  const {GoogleAuth} = require('google-auth-library');
  const {google} = require('googleapis');

  const auth = new GoogleAuth({
    scopes: 'https://www.googleapis.com/auth/presentations',
  });

  const service = google.slides({version: 'v1', auth});

  const requests = [
    {
      refreshSheetsChart: {
        objectId: presentationChartId,
      },
    },
  ];

  // Execute the request.
  try {
    const batchUpdateResponse = await service.presentations.batchUpdate({
      presentationId,
      resource: {
        requests,
      },
    });
    console.log(
        `Refreshed a linked Sheets chart with ID: ${presentationChartId}`,
    );
    return batchUpdateResponse.data;
  } catch (err) {
    // TODO (developer) - Handle exception
    throw err;
  }
}

PHP

slides/snippets/src/SlidesRefreshSheetsChart.php
use Google\Client;
use Google\Service\Drive;
use Google\Service\Slides;
use Google\Service\Slides\BatchUpdatePresentationRequest;

function refreshSheetsChart($presentationId, $presentationChartId)
{
    /* Load pre-authorized user credentials from the environment.
       TODO(developer) - See https://developers.google.com/identity for
        guides on implementing OAuth2 for your application. */
    $client = new Google\Client();
    $client->useApplicationDefaultCredentials();
    $client->addScope(Google\Service\Drive::DRIVE);
    $slidesService = new Google_Service_Slides($client);
    try {

        $requests = array();
        $requests[] = new Google_Service_Slides_Request(array(
            'refreshSheetsChart' => array(
                'objectId' => $presentationChartId
            )
        ));

        // Execute the request.
        $batchUpdateRequest = new Google_Service_Slides_BatchUpdatePresentationRequest(array(
            'requests' => $requests
        ));
        $response = $slidesService->presentations->batchUpdate($presentationId, $batchUpdateRequest);
        printf("Refreshed a linked Sheets chart with ID: %s\n", $response->getPresentationId());
        return $response;
    } catch (Exception $e) {
        echo 'Message: ' . $e->getMessage();
    }
}

Python

slides/snippets/slides_refresh_sheets_chart.py
import google.auth
from googleapiclient.discovery import build
from googleapiclient.errors import HttpError


def refresh_sheets_chart(presentation_id, presentation_chart_id):
  """
  refresh_sheets_chart the user has access to.
  Load pre-authorized user credentials from the environment.
  TODO(developer) - See https://developers.google.com/identity
  for guides on implementing OAuth2 for the application.
  """
  creds, _ = google.auth.default()
  # pylint: disable=maybe-no-member
  try:
    slides_service = build("slides", "v1", credentials=creds)
    # Refresh an existing linked Sheets chart embedded in a presentation.
    requests = [{"refreshSheetsChart": {"objectId": presentation_chart_id}}]

    # Execute the request.
    body = {"requests": requests}
    response = (
        slides_service.presentations()
        .batchUpdate(presentationId=presentation_id, body=body)
        .execute()
    )
    print(f"Refreshed a linked Sheets chart with ID:{presentation_chart_id}")
    return response
  except HttpError as error:
    print(f"An error occurred: {error}")
    return error


if __name__ == "__main__":
  # Put the presentation_id, presentation_chart_id
  # to be submitted.
  refresh_sheets_chart(
      "10QnVUx1X2qHsL17WUidGpPh_SQhXYx40CgIxaKk8jU4", "1107320627"
  )

Ruby

slides/snippets/lib/file_snippets.rb
# Refresh an existing linked Sheets chart embedded in a presentation.
requests = [{
  refresh_sheets_chart: {
    object_id_prop: presentation_chart_id
  }
}]

# Execute the request.
req = Google::Apis::SlidesV1::BatchUpdatePresentationRequest.new(requests: requests)
response = slides_service.batch_update_presentation(presentation_id, req)

puts "Refreshed a linked Sheets chart with ID: #{presentation_chart_id}"