- Chủ sở hữu danh mục
- Danh mục cộng đồng Awesome GEE
- Phạm vi cung cấp tập dữ liệu
- 2000-01-04T00:00:00Z–2026-06-30T00:00:00Z
- Nhà sản xuất tập dữ liệu
- National Drought Mitigation Center
- Thẻ
Mô tả
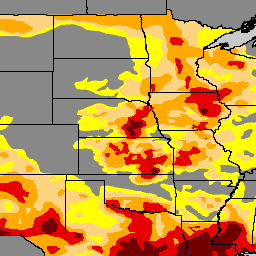
U.S. Drought Monitor (Bản đồ giám sát hạn hán ở Hoa Kỳ) là một bản đồ được phát hành vào thứ Năm hằng tuần, cho thấy các khu vực ở Hoa Kỳ đang bị hạn hán. Bản đồ này sử dụng 5 loại phân loại: khô bất thường (D0), cho thấy các khu vực có thể đang bị hạn hán hoặc vừa thoát khỏi hạn hán, và 4 mức độ hạn hán: hạn hán vừa phải (D1), hạn hán nghiêm trọng (D2), hạn hán khắc nghiệt (D3) và hạn hán đặc biệt (D4). Drought Monitor (Bản đồ giám sát hạn hán) là kết quả của sự hợp tác từ khi ra đời vào năm 1999, do National Drought Mitigation Center (NDMC) (Trung tâm giảm thiểu hạn hán quốc gia) tại Đại học Nebraska-Lincoln, National Oceanic and Atmospheric Administration (NOAA) (Cơ quan Quản lý Đại dương và Khí quyển Quốc gia) và U.S. Department of Agriculture (USDA) (Bộ Nông nghiệp Hoa Kỳ) cùng sản xuất. NDMC lưu trữ trang web của bản đồ giám sát hạn hán và dữ liệu liên quan, đồng thời cung cấp bản đồ và dữ liệu cho NOAA, USDA và các cơ quan khác. Bạn có thể truy cập miễn phí tại droughtmonitor.unl.edu.
Băng tần
Băng tần
Kích thước pixel: 250 mét (tất cả các băng tần)
| Tên | Tối thiểu | Tối đa | Kích thước pixel | Mô tả |
|---|---|---|---|---|
DM |
0 | 4 | 250 mét | Các loại hạn hán |
Điều khoản sử dụng
Điều khoản sử dụng
Tác phẩm này được cấp phép theo Giấy phép dữ liệu mở để sử dụng. U.S. Drought Monitor (Bản đồ giám sát hạn hán ở Hoa Kỳ) do National Drought Mitigation Center (Trung tâm giảm thiểu hạn hán quốc gia) tại Đại học Nebraska-Lincoln, United States Department of Agriculture (Bộ Nông nghiệp Hoa Kỳ) và National Oceanic and Atmospheric Administration (Cơ quan Quản lý Đại dương và Khí quyển Quốc gia) cùng sản xuất. Bản đồ do NDMC cung cấp.
Trích dẫn
National Drought Mitigation Center (Trung tâm giảm thiểu hạn hán quốc gia); U.S. Department of Agriculture (Bộ Nông nghiệp Hoa Kỳ); National Oceanic and Atmospheric Administration (Cơ quan Quản lý Đại dương và Khí quyển Quốc gia) (2023). United States Drought Monitor (Bản đồ giám sát hạn hán ở Hoa Kỳ). Đại học Nebraska-Lincoln. https://droughtmonitor.unl.edu/. Thời gian truy cập: 17/9/2023
Khám phá bằng Earth Engine
Trình soạn thảo mã (JavaScript)
var usdm = ee.ImageCollection(
  "projects/sat-io/open-datasets/us-drought-monitor"
);
/*
Category	Description
DO	Abnormally Dry
D1	Moderate Drought
D2	Severe Drought
D3	Extreme Drought
D4	Exceptional Drought
*/

var usdm = ee.Image(usdm.toList(usdm.size()).get(-1));

// Define a dictionary which will be used to make legend and visualize image on map
var dict = {
  names: [
    "DO	Abnormally Dry", //1
    "D1 Moderate Drought", //2
    "D2 Severe Drought", //3
    "D3 Extreme Drought", //4
    "D4 Exceptional Drought", //5
  ],
  colors: ["FFFF00", "FCD37F", "FFAA00", "E60000", "730000"],
};

// Create a panel to hold the legend widget
var legend = ui.Panel({
  style: {
    position: "bottom-left",
    padding: "8px 15px",
  },
});

// Function to generate the legend
function addCategoricalLegend(panel, dict, title) {
  // Create and add the legend title.
  var legendTitle = ui.Label({
    value: title,
    style: {
      fontWeight: "bold",
      fontSize: "18px",
      margin: "0 0 4px 0",
      padding: "0",
    },
  });
  panel.add(legendTitle);

  var loading = ui.Label("Loading legend...", { margin: "2px 0 4px 0" });
  panel.add(loading);

  // Creates and styles 1 row of the legend.
  var makeRow = function (color, name) {
    // Create the label that is actually the colored box.
    var colorBox = ui.Label({
      style: {
        backgroundColor: color,
        // Use padding to give the box height and width.
        padding: "8px",
        margin: "0 0 4px 0",
      },
    });

    // Create the label filled with the description text.
    var description = ui.Label({
      value: name,
      style: { margin: "0 0 4px 6px" },
    });

    return ui.Panel({
      widgets: [colorBox, description],
      layout: ui.Panel.Layout.Flow("horizontal"),
    });
  };

  // Get the list of palette colors and class names from the image.
  var palette = dict["colors"];
  var names = dict["names"];
  loading.style().set("shown", false);

  for (var i = 0; i < names.length; i++) {
    panel.add(makeRow(palette[i], names[i]));
  }

  Map.add(panel);
}

/*
  // Display map and legend ///////////////////////////////////////////////////////////////////////////////
*/

// Add the legend to the map
addCategoricalLegend(legend, dict, "US Drought Monitor");

// Add USDM Image image to the map
Map.addLayer(
  usdm,
  { min: 0, max: 4, palette: dict["colors"] },
  usdm.get("system:index").getInfo()
);