- 카탈로그 소유자
- Awesome GEE Community Catalog
- 데이터 세트 제공
- 2000-01-04T00:00:00Z–2026-06-16T00:00:00Z
- 데이터 세트 출처
- National Drought Mitigation Center
- 태그
설명
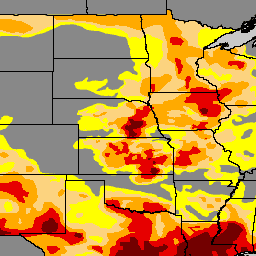
미국 가뭄 모니터는 매주 목요일에 발표되는 지도로, 가뭄이 발생한 미국 지역을 보여줍니다. 이 지도에서는 비정상적으로 건조한 지역(D0)을 표시하여 가뭄이 시작되거나 끝나는 지역을 보여주고, 4단계의 가뭄(보통(D1), 심각(D2), 극심(D3), 매우 심각(D4))을 사용합니다. 가뭄 모니터는 1999년 시작된 이후로 네브래스카-링컨 대학교의 국립 가뭄 완화 센터 (NDMC), 국립해양대기청 (NOAA), 미국 농무부 (USDA)가 공동으로 제작한 팀 노력의 결과입니다. NDMC는 가뭄 모니터 웹사이트와 관련 데이터를 호스팅하고 NOAA, USDA 및 기타 기관에 지도와 데이터를 제공합니다. droughtmonitor.unl.edu에서 무료로 이용할 수 있습니다.
대역
대역
픽셀 크기: 250m (모든 밴드)
| 이름 | 최소 | 최대 | 픽셀 크기 | 설명 |
|---|---|---|---|---|
DM |
0 | 4 | 250미터 | 가뭄 클래스 |
이용약관
이용약관
이 저작물은 사용을 위한 오픈 데이터 라이선스에 따라 라이선스가 부여됩니다. 미국 가뭄 모니터는 네브래스카-링컨 대학교의 국립 가뭄 완화 센터, 미국 농무부, 국립해양대기국이 공동으로 제작합니다. 지도 출처: NDMC
인용
인용:
National Drought Mitigation Center, U.S. Department of Agriculture, National Oceanic and Atmospheric Administration (2023). 미국 가뭄 모니터 네브래스카 대학교 링컨 캠퍼스. https://droughtmonitor.unl.edu/ 2023년 9월 17일에 액세스함
Earth Engine으로 탐색
코드 편집기(JavaScript)
var usdm = ee.ImageCollection(
  "projects/sat-io/open-datasets/us-drought-monitor"
);
/*
Category	Description
DO	Abnormally Dry
D1	Moderate Drought
D2	Severe Drought
D3	Extreme Drought
D4	Exceptional Drought
*/

var usdm = ee.Image(usdm.toList(usdm.size()).get(-1));

// Define a dictionary which will be used to make legend and visualize image on map
var dict = {
  names: [
    "DO	Abnormally Dry", //1
    "D1 Moderate Drought", //2
    "D2 Severe Drought", //3
    "D3 Extreme Drought", //4
    "D4 Exceptional Drought", //5
  ],
  colors: ["FFFF00", "FCD37F", "FFAA00", "E60000", "730000"],
};

// Create a panel to hold the legend widget
var legend = ui.Panel({
  style: {
    position: "bottom-left",
    padding: "8px 15px",
  },
});

// Function to generate the legend
function addCategoricalLegend(panel, dict, title) {
  // Create and add the legend title.
  var legendTitle = ui.Label({
    value: title,
    style: {
      fontWeight: "bold",
      fontSize: "18px",
      margin: "0 0 4px 0",
      padding: "0",
    },
  });
  panel.add(legendTitle);

  var loading = ui.Label("Loading legend...", { margin: "2px 0 4px 0" });
  panel.add(loading);

  // Creates and styles 1 row of the legend.
  var makeRow = function (color, name) {
    // Create the label that is actually the colored box.
    var colorBox = ui.Label({
      style: {
        backgroundColor: color,
        // Use padding to give the box height and width.
        padding: "8px",
        margin: "0 0 4px 0",
      },
    });

    // Create the label filled with the description text.
    var description = ui.Label({
      value: name,
      style: { margin: "0 0 4px 6px" },
    });

    return ui.Panel({
      widgets: [colorBox, description],
      layout: ui.Panel.Layout.Flow("horizontal"),
    });
  };

  // Get the list of palette colors and class names from the image.
  var palette = dict["colors"];
  var names = dict["names"];
  loading.style().set("shown", false);

  for (var i = 0; i < names.length; i++) {
    panel.add(makeRow(palette[i], names[i]));
  }

  Map.add(panel);
}

/*
  // Display map and legend ///////////////////////////////////////////////////////////////////////////////
*/

// Add the legend to the map
addCategoricalLegend(legend, dict, "US Drought Monitor");

// Add USDM Image image to the map
Map.addLayer(
  usdm,
  { min: 0, max: 4, palette: dict["colors"] },
  usdm.get("system:index").getInfo()
);