

- בעלי הקטלוג
- Awesome GEE Community Catalog
- זמינות קבוצת הנתונים
- 2000-01-04T00:00:00Z–2026-10-06T00:00:00Z
- מפיק קבוצת הנתונים
- National Drought Mitigation Center
- תגים
תיאור
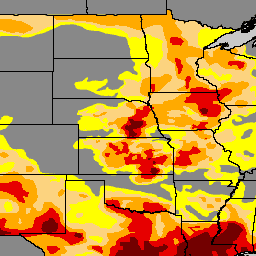
ה-U.S. Drought Monitor (מעקב הבצורת בארה"ב) הוא מפה שמתפרסמת בכל יום חמישי, ומוצגים בה האזורים בארה"ב שסובלים מבצורת. במפה יש חמישה סיווגים: יובש חריג (D0), שמציג אזורים שעלולים להיכנס לבצורת או לצאת ממנה, וארבע רמות של בצורת: בינונית (D1), חמורה (D2), קיצונית (D3) וחריגה (D4). ה-Drought Monitor הוא פרויקט משותף מאז הקמתו בשנת 1999, והוא מופק על ידי National Drought Mitigation Center (המרכז הלאומי להפחתת השפעות הבצורת, NDMC) באוניברסיטת נברסקה-לינקולן, National Oceanic and Atmospheric Administration (מנהל האוקיינוסים והאטמוספירה הלאומי של ארה"ב, NOAA) ומשרד החקלאות של ארה"ב (USDA). ה-NDMC מארח את האתר של מעקב הבצורת ואת הנתונים המשויכים, ומספק את המפה והנתונים ל-NOAA, ל-USDA ולסוכנויות אחרות. הוא זמין בחינם בכתובת droughtmonitor.unl.edu.
תחום תדרים
תחום תדרים
גודל הפיקסל: 250 מטרים (כל הרצועות)
| שם | מינימום | מקסימום | גודל הפיקסל | תיאור |
|---|---|---|---|---|
DM |
0 | 4 | 250 מטרים | סיווגי בצורת |
תנאים והגבלות
תנאים והגבלות
היצירה מורשית לשימוש במסגרת רישיון לנתונים פתוחים. ה-U.S. Drought Monitor מופק במשותף על ידי National Drought Mitigation Center באוניברסיטת נברסקה-לינקולן, משרד החקלאות של ארה"ב ו-National Oceanic and Atmospheric Administration. המפה באדיבות NDMC.
ציטוטים ביבליוגרפיים
National Drought Mitigation Center; U.S. Department of Agriculture; National Oceanic and Atmospheric Administration (2023). United States Drought Monitor. University of Nebraska-Lincoln. https://droughtmonitor.unl.edu/. Accessed 2023-09-17
סיור עם פלטפורמת Earth Engine
עורך קוד (JavaScript)
var usdm = ee.ImageCollection(
  "projects/sat-io/open-datasets/us-drought-monitor"
);
/*
Category	Description
DO	Abnormally Dry
D1	Moderate Drought
D2	Severe Drought
D3	Extreme Drought
D4	Exceptional Drought
*/

var usdm = ee.Image(usdm.toList(usdm.size()).get(-1));

// Define a dictionary which will be used to make legend and visualize image on map
var dict = {
  names: [
    "DO	Abnormally Dry", //1
    "D1 Moderate Drought", //2
    "D2 Severe Drought", //3
    "D3 Extreme Drought", //4
    "D4 Exceptional Drought", //5
  ],
  colors: ["FFFF00", "FCD37F", "FFAA00", "E60000", "730000"],
};

// Create a panel to hold the legend widget
var legend = ui.Panel({
  style: {
    position: "bottom-left",
    padding: "8px 15px",
  },
});

// Function to generate the legend
function addCategoricalLegend(panel, dict, title) {
  // Create and add the legend title.
  var legendTitle = ui.Label({
    value: title,
    style: {
      fontWeight: "bold",
      fontSize: "18px",
      margin: "0 0 4px 0",
      padding: "0",
    },
  });
  panel.add(legendTitle);

  var loading = ui.Label("Loading legend...", { margin: "2px 0 4px 0" });
  panel.add(loading);

  // Creates and styles 1 row of the legend.
  var makeRow = function (color, name) {
    // Create the label that is actually the colored box.
    var colorBox = ui.Label({
      style: {
        backgroundColor: color,
        // Use padding to give the box height and width.
        padding: "8px",
        margin: "0 0 4px 0",
      },
    });

    // Create the label filled with the description text.
    var description = ui.Label({
      value: name,
      style: { margin: "0 0 4px 6px" },
    });

    return ui.Panel({
      widgets: [colorBox, description],
      layout: ui.Panel.Layout.Flow("horizontal"),
    });
  };

  // Get the list of palette colors and class names from the image.
  var palette = dict["colors"];
  var names = dict["names"];
  loading.style().set("shown", false);

  for (var i = 0; i < names.length; i++) {
    panel.add(makeRow(palette[i], names[i]));
  }

  Map.add(panel);
}

/*
  // Display map and legend ///////////////////////////////////////////////////////////////////////////////
*/

// Add the legend to the map
addCategoricalLegend(legend, dict, "US Drought Monitor");

// Add USDM Image image to the map
Map.addLayer(
  usdm,
  { min: 0, max: 4, palette: dict["colors"] },
  usdm.get("system:index").getInfo()
);