Page Summary
-
The WeatherNext Graph dataset provides experimental global medium-range weather forecasts from an operational version of Google DeepMind's graphical neural network weather model.
-
This dataset contains both real-time data (within the last 48 hours) and historic data (older than 48 hours), covering major surface fields like temperature, wind, precipitation, and more.
-
The data has a spatial resolution of 0.25 degrees, with forecast initiation times every 6 hours and lead times up to 10 days, also with 6-hour resolution.
-
Access to this experimental dataset requires filling out the WeatherNext Data Request form, and raw historic data in .zarr format is also available upon request.
-
Different terms of use and citation requirements apply to the Real-Time and Historic Experimental Data, with third-party materials also potentially subject to separate conditions.
- Catalog Owner
- WeatherNext
- Dataset Availability
- 2020-01-01T00:00:00Z–2026-06-17T18:00:00Z
- Dataset Producer
- Tags
Description
DEPRECATION NOTICE: This dataset is scheduled for deprecation on July 15, 2026. To ensure service continuity, users must migrate all active workflows to WeatherNext 2. For more details, see our deprecation page.
WeatherNext Graph is an experimental dataset of global medium-range weather forecasts produced by an operational version of Google DeepMind's graphical neural network weather model.
The experimental dataset includes real-time and historic data. Real-time data is any data that relates to a time that is no more than 48 hours in the past ("Real-Time Experimental Data"), while historic data is any data that relates to a time that is more than 48 hours ago ("Historic Experimental Data"). This dataset includes major surface fields including temperature, wind, precipitation, humidity, geopotential, vertical velocity, and pressure. The spatial resolution is 0.25 degrees. Forecast init times have 6 hour resolution (00z, 06z, 12z, 18z). Forecast lead times have 6 hour resolution up to a max lead time of 10 days.
If you are interested in accessing the experimental dataset, please fill out this WeatherNext Data Request form.
More information on the model is in "Learning skillful medium-range global weather forecasting". The model used to produce this experimental dataset is an operational version derived from that research model (formerly known as GraphCast). Please note that the accuracy of this operational model may not directly correspond to the accuracy reported for the research model, and that additional variables may be included in this forecast dataset.
If you have any questions on using this experimental dataset, or would like to use it for purposes not currently permitted under the terms of use set out below, please contact weathernext@google.com.
Dissemination Schedule
All steps are released at once. All times are in the UTC time zone and are rough estimates (with typical ± 15 minutes variance). On occasion, times may vary up to ± 60 minutes or more. If data delivery exceeds +60 minutes, please inform us via weathernext@google.com.
| Forecast runs (init time) | Forecast dissemination schedule |
|---|---|
| 00:00 | 06:45 |
| 06:00 | 12:45 |
| 12:00 | 18:45 |
| 18:00 | 00:45 |
Accessing Raw Data (.zarr)
A bucket containing the raw .zarr files for the historical dataset
("Historic Experimental Data") is available at gs://weathernext/59572747_4_0/zarr. To gain access to
the bucket, please request access through the same WeatherNext Data Request form,
and note your interest in receiving access to the raw .zarr files.
Acknowledgements
The experimental data was generated by models which communicate with and/or reference the following separate libraries and packages:
- Data and products of the European Centre for Medium-range Weather Forecasts (ECMWF), as modified by Google.
- Modified Copernicus Climate Change Service information 2023. Neither the European Commission nor ECMWF is responsible for any use that may be made of the Copernicus information or data it contains.
- ECMWF HRES datasets
- Copyright statement: Copyright "© 2023 European Centre for Medium-Range Weather Forecasts (ECMWF)".
- Source: www.ecmwf.int
- License Statement: ECMWF open data is published under a Creative Commons Attribution 4.0 International (CC BY 4.0). https://creativecommons.org/licenses/by/4.0/
- Disclaimer: ECMWF does not accept any liability whatsoever for any error or omission in the data, their availability, or for any loss or damage arising from their use.
Bands
Bands
Pixel size: 27830 meters (all bands)
| Name | Units | Pixel Size | Description |
|---|---|---|---|
total_precipitation_6hr |
m | 27830 meters | Total precipitation over a 6-hour period |
10m_u_component_of_wind |
m/s | 27830 meters | 10 meter U wind component |
10m_v_component_of_wind |
m/s | 27830 meters | 10 meter V wind component |
2m_temperature |
K | 27830 meters | 2 meter temperature |
mean_sea_level_pressure |
Pa | 27830 meters | Mean sea level pressure |
50_geopotential |
m^2/s^2 | 27830 meters | Geopotential at 50 hPa |
100_geopotential |
m^2/s^2 | 27830 meters | Geopotential at 100 hPa |
150_geopotential |
m^2/s^2 | 27830 meters | Geopotential at 150 hPa |
200_geopotential |
m^2/s^2 | 27830 meters | Geopotential at 200 hPa |
250_geopotential |
m^2/s^2 | 27830 meters | Geopotential at 250 hPa |
300_geopotential |
m^2/s^2 | 27830 meters | Geopotential at 300 hPa |
400_geopotential |
m^2/s^2 | 27830 meters | Geopotential at 400 hPa |
500_geopotential |
m^2/s^2 | 27830 meters | Geopotential at 500 hPa |
600_geopotential |
m^2/s^2 | 27830 meters | Geopotential at 600 hPa |
700_geopotential |
m^2/s^2 | 27830 meters | Geopotential at 700 hPa |
850_geopotential |
m^2/s^2 | 27830 meters | Geopotential at 850 hPa |
925_geopotential |
m^2/s^2 | 27830 meters | Geopotential at 925 hPa |
1000_geopotential |
m^2/s^2 | 27830 meters | Geopotential at 1000 hPa |
50_specific_humidity |
kg/kg | 27830 meters | Specific humidity at 50 hPa |
100_specific_humidity |
kg/kg | 27830 meters | Specific humidity at 100 hPa |
150_specific_humidity |
kg/kg | 27830 meters | Specific humidity at 150 hPa |
200_specific_humidity |
kg/kg | 27830 meters | Specific humidity at 200 hPa |
250_specific_humidity |
kg/kg | 27830 meters | Specific humidity at 250 hPa |
300_specific_humidity |
kg/kg | 27830 meters | Specific humidity at 300 hPa |
400_specific_humidity |
kg/kg | 27830 meters | Specific humidity at 400 hPa |
500_specific_humidity |
kg/kg | 27830 meters | Specific humidity at 500 hPa |
600_specific_humidity |
kg/kg | 27830 meters | Specific humidity at 600 hPa |
700_specific_humidity |
kg/kg | 27830 meters | Specific humidity at 700 hPa |
850_specific_humidity |
kg/kg | 27830 meters | Specific humidity at 850 hPa |
925_specific_humidity |
kg/kg | 27830 meters | Specific humidity at 925 hPa |
1000_specific_humidity |
kg/kg | 27830 meters | Specific humidity at 1000 hPa |
50_temperature |
K | 27830 meters | Temperature at 50 hPa |
100_temperature |
K | 27830 meters | Temperature at 100 hPa |
150_temperature |
K | 27830 meters | Temperature at 150 hPa |
200_temperature |
K | 27830 meters | Temperature at 200 hPa |
250_temperature |
K | 27830 meters | Temperature at 250 hPa |
300_temperature |
K | 27830 meters | Temperature at 300 hPa |
400_temperature |
K | 27830 meters | Temperature at 400 hPa |
500_temperature |
K | 27830 meters | Temperature at 500 hPa |
600_temperature |
K | 27830 meters | Temperature at 600 hPa |
700_temperature |
K | 27830 meters | Temperature at 700 hPa |
850_temperature |
K | 27830 meters | Temperature at 850 hPa |
925_temperature |
K | 27830 meters | Temperature at 925 hPa |
1000_temperature |
K | 27830 meters | Temperature at 1000 hPa |
50_u_component_of_wind |
m/s | 27830 meters | U wind component at 50 hPa |
100_u_component_of_wind |
m/s | 27830 meters | U wind component at 100 hPa |
150_u_component_of_wind |
m/s | 27830 meters | U wind component at 150 hPa |
200_u_component_of_wind |
m/s | 27830 meters | U wind component at 200 hPa |
250_u_component_of_wind |
m/s | 27830 meters | U wind component at 250 hPa |
300_u_component_of_wind |
m/s | 27830 meters | U wind component at 300 hPa |
400_u_component_of_wind |
m/s | 27830 meters | U wind component at 400 hPa |
500_u_component_of_wind |
m/s | 27830 meters | U wind component at 500 hPa |
600_u_component_of_wind |
m/s | 27830 meters | U wind component at 600 hPa |
700_u_component_of_wind |
m/s | 27830 meters | U wind component at 700 hPa |
850_u_component_of_wind |
m/s | 27830 meters | U wind component at 850 hPa |
925_u_component_of_wind |
m/s | 27830 meters | U wind component at 925 hPa |
1000_u_component_of_wind |
m/s | 27830 meters | U wind component at 1000 hPa |
50_v_component_of_wind |
m/s | 27830 meters | V wind component at 50 hPa |
100_v_component_of_wind |
m/s | 27830 meters | V wind component at 100 hPa |
150_v_component_of_wind |
m/s | 27830 meters | V wind component at 150 hPa |
200_v_component_of_wind |
m/s | 27830 meters | V wind component at 200 hPa |
250_v_component_of_wind |
m/s | 27830 meters | V wind component at 250 hPa |
300_v_component_of_wind |
m/s | 27830 meters | V wind component at 300 hPa |
400_v_component_of_wind |
m/s | 27830 meters | V wind component at 400 hPa |
500_v_component_of_wind |
m/s | 27830 meters | V wind component at 500 hPa |
600_v_component_of_wind |
m/s | 27830 meters | V wind component at 600 hPa |
700_v_component_of_wind |
m/s | 27830 meters | V wind component at 700 hPa |
850_v_component_of_wind |
m/s | 27830 meters | V wind component at 850 hPa |
925_v_component_of_wind |
m/s | 27830 meters | V wind component at 925 hPa |
1000_v_component_of_wind |
m/s | 27830 meters | V wind component at 1000 hPa |
50_vertical_velocity |
Pa/s | 27830 meters | Vertical velocity at 50 hPa |
100_vertical_velocity |
Pa/s | 27830 meters | Vertical velocity at 100 hPa |
150_vertical_velocity |
Pa/s | 27830 meters | Vertical velocity at 150 hPa |
200_vertical_velocity |
Pa/s | 27830 meters | Vertical velocity at 200 hPa |
250_vertical_velocity |
Pa/s | 27830 meters | Vertical velocity at 250 hPa |
300_vertical_velocity |
Pa/s | 27830 meters | Vertical velocity at 300 hPa |
400_vertical_velocity |
Pa/s | 27830 meters | Vertical velocity at 400 hPa |
500_vertical_velocity |
Pa/s | 27830 meters | Vertical velocity at 500 hPa |
600_vertical_velocity |
Pa/s | 27830 meters | Vertical velocity at 600 hPa |
700_vertical_velocity |
Pa/s | 27830 meters | Vertical velocity at 700 hPa |
850_vertical_velocity |
Pa/s | 27830 meters | Vertical velocity at 850 hPa |
925_vertical_velocity |
Pa/s | 27830 meters | Vertical velocity at 925 hPa |
1000_vertical_velocity |
Pa/s | 27830 meters | Vertical velocity at 1000 hPa |
Image Properties
Image Properties
| Name | Type | Description |
|---|---|---|
| start_time | STRING | The initialization time of the forecast. This is the same for all forecast hours within a single model run. |
| end_time | STRING | The valid time for this specific forecast. Calculated as start_time + forecast_hour. |
| forecast_hour | INT | The forecast lead time in hours. Represents the number of hours from the start_time. |
| ingestion_time | DOUBLE | The time when this forecast data became available in Earth Engine. |
Terms of Use
Terms of Use
The Historic Experimental Data is licensed under the Creative Commons Attribution International License, Version 4.0 (CC BY 4.0).
The Real-Time Experimental Data is made available under the following GDM Real-Time Weather Forecasting Experimental Data Terms of Use.
Third-party materials
Use of the third-party materials referred to in the Acknowledgements section may be governed by separate terms and conditions or license provisions. Your use of the third-party materials is subject to any such terms and you should check that you can comply with any applicable restrictions or terms and conditions before use.
Citations
For Real-Time Experimental Data, please see the applicable Terms of Use for citation requirements.
If you disclose findings arising from the Historical Data, you must cite "© 2024 DeepMind Technologies Limited's machine learning models used to create the experimental data made available at https://developers.google.com/earth-engine/datasets/catalog/projects_gcp-public-data-weathernext_assets_59572747_4_0 under CC BY 4.0 licence terms. This data is intended for experimental modelling only and is not intended, validated, or approved for real world use."
Explore with Earth Engine
Code Editor (JavaScript)
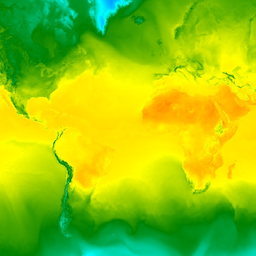
var dataset =
    ee.ImageCollection(
          'projects/gcp-public-data-weathernext/assets/59572747_4_0')
        .filter(ee.Filter.date('2020-10-01T06:00:00Z', '2020-10-01T06:01:00Z'))
        .filter(ee.Filter.eq('forecast_hour', 6));
var temperature = dataset.select('2m_temperature');

var visParams = {
  min: 220,
  max: 350,
  palette: [
    'darkblue', 'blue', 'cyan', 'green', 'yellow', 'orange', 'red', 'darkred'
  ]
};

Map.addLayer(temperature, visParams, '2m Temperature');