- זמינות קבוצת הנתונים
- 1981-01-01T00:00:00Z–2026-05-31T00:00:00Z
- מפיק מערך הנתונים
- UCSB/CHG
- קצב
- יום אחד
- תגים
תיאור
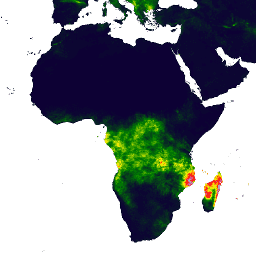
Climate Hazards Center InfraRed Precipitation with Station data (או CHIRPS) היא קבוצת נתונים של גשמים כמעט גלובלית, שכוללת נתונים מ-30 השנים האחרונות. קבוצת הנתונים CHIRPS משלבת תצלומי לוויין ברזולוציה של 0.05° עם נתונים מתחנות מדידה באתר כדי ליצור סדרות זמן של גשמים ברשת לניתוח מגמות ולמעקב אחרי בצורת עונתית.
תחום תדרים
תחום תדרים
גודל הפיקסל: 5,566 מטרים (כל הפסים)
| שם | יחידות | מינימום | מקסימום | גודל הפיקסל | תיאור |
|---|---|---|---|---|---|
precipitation |
mm/d | 0* | 1444.34* | 5,566 מטרים | משקעים |
תנאים והגבלות
תנאים והגבלות
קבוצת הנתונים הזו היא נחלת הכלל. במידה המקסימלית שמותרת על פי חוק, Pete Peterson ויתר על כל זכויות היוצרים ועל זכויות קרובות או שכנות ל-Climate Hazards Center Infrared Precipitation with Stations (CHIRPS).
ציטוטים ביבליוגרפיים
Funk, Chris, Pete Peterson, Martin Landsfeld, Diego Pedreros, James Verdin, Shraddhanand Shukla, Gregory Husak, James Rowland, Laura Harrison, Andrew Hoell & Joel Michaelsen. "The climate hazards infrared precipitation with stations-a new environmental record for monitoring extremes". Scientific Data 2, 150066. doi:10.1038/sdata.2015.66 2015.
סיור עם פלטפורמת Earth Engine
Code Editor (JavaScript)
var dataset = ee.ImageCollection('UCSB-CHG/CHIRPS/DAILY')
                  .filter(ee.Filter.date('2018-05-01', '2018-05-03'));
var precipitation = dataset.select('precipitation');
var precipitationVis = {
  min: 1,
  max: 17,
  palette: ['001137', '0aab1e', 'e7eb05', 'ff4a2d', 'e90000'],
};
Map.setCenter(17.93, 7.71, 2);
Map.addLayer(precipitation, precipitationVis, 'Precipitation');
import ee
import geemap.core as geemap
Colab (Python)
dataset = ee.ImageCollection('UCSB-CHG/CHIRPS/DAILY').filter(
    ee.Filter.date('2018-05-01', '2018-05-03')
)
precipitation = dataset.select('precipitation')
precipitation_vis = {
    'min': 1,
    'max': 17,
    'palette': ['001137', '0aab1e', 'e7eb05', 'ff4a2d', 'e90000'],
}

m = geemap.Map()
m.set_center(17.93, 7.71, 2)
m.add_layer(precipitation, precipitation_vis, 'Precipitation')
m