
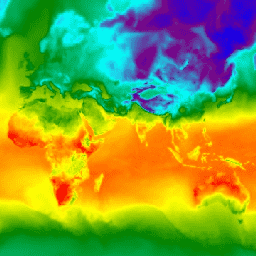
- 利用可能なデータセットの期間
- 2015-07-01T00:00:00Z–2026-10-24T18:00:00Z
- データセット プロデューサー
- NOAA/NCEP/EMC
- ケイデンス
- 6 時間
- タグ
説明
Global Forecast System(GFS)は、米国国立環境予測センター(NCEP)が作成した天気予報モデルです。GFS データセットは、選択されたモデル出力(後述)をグリッド予測変数として構成されています。384 時間の予測は、1 時間(最大 120 時間)と 3 時間(120 時間後)の予測間隔で、6 時間の時間解像度(1 日に 4 回更新)で行われます。「creation_time」プロパティと「forecast_time」プロパティを使用して、目的のデータを選択します。
GFS は、大気モデル、海洋モデル、陸地/土壌モデル、海氷モデルで構成される結合モデルであり、これらが連携して気象条件を正確に把握します。このモデルは変更される可能性があります。詳細については、グローバル予測/分析システムの最近の変更履歴とドキュメントをご覧ください。時間単位や日単位で大きな変動が生じる可能性があるため、分析前にバンドにノイズ低減手法を適用する必要があります。
利用可能な予測時間と間隔は、時間の経過とともに変化しています。
- 2015 年 4 月 1 日~ 2017 年 7 月 9 日: 36 時間の予測(0 時を除く、3 時間間隔)。
- 2017 年 7 月 9 日~ 2021 年 6 月 11 日: 384 時間の予測。0 ~ 120 時間は 1 時間間隔、120 ~ 240 時間は 3 時間間隔、240 ~ 384 時間は 12 時間間隔。
- 2021 年 6 月 12 日以降: 384 時間の予測。0 ~ 120 時間は 1 時間間隔、120 ~ 384 時間は 3 時間間隔。
一部のバンドは、バンドの説明に記載されているように、2025 年 1 月 15 日以降にのみ利用可能になります。
バンド
バンド
ピクセルサイズ: 27,830 メートル(すべてのバンド)
| 名前 | 単位 | 最小 | 最大 | ピクセルサイズ | 説明 |
|---|---|---|---|---|---|
temperature_2m_above_ground |
°C | -69.18* | 52.25* | 27,830 m | 地上 2 m の気温 |
specific_humidity_2m_above_ground |
質量分率 | 0* | 0.03* | 27,830 m | 地上 2 m の比湿 |
dew_point_temperature_2m_above_ground |
°C | -81.05* | 29.05* | 27,830 m | 地上 2 m の露点温度(2025 年 1 月 15 日から利用可能) |
relative_humidity_2m_above_ground |
% | 1* | 100.05* | 27,830 m | 地上 2 m の相対湿度 |
maximum_temperature_2m_above_ground |
°C | -60.73* | 59.28* | 27,830 m | 地上 2 m の最高気温(2025 年 1 月 15 日から利用可能。ただし、forecast_hours > 0 のアセットのみ) |
minimum_temperature_2m_above_ground |
°C | -63.78* | 59.39* | 27,830 m | 地上 2 m の最低気温(2025 年 1 月 15 日から利用可能。ただし、forecast_hours > 0 のアセットのみ) |
u_component_of_wind_10m_above_ground |
m/s | -60.73* | 59.28* | 27,830 m | 地上 10 m での風の U 成分 |
v_component_of_wind_10m_above_ground |
m/s | -63.78* | 59.39* | 27,830 m | 地上 10 m の風の V 成分 |
total_precipitation_surface |
kg/m^2 | 0* | 626.75* | 27,830 m | 過去 1 ~ 6 時間の地表の累積降水量。forecast_hours プロパティの値に応じて、式 ((F - 1) % 6) + 1 に従って計算されます(forecast_hours > 0 のアセットのみ)。 そのため、X 時間までの合計降水量を計算するには、6 の倍数に X に達するまでの残りの時間を加えた forecast_hours の値のみを合計して、重複カウントを回避する必要があります。また、X 時間目の降水量を特定するには、X が 6 時間枠の最初の時間でない限り、前の時間の値を差し引く必要があります。 |
precipitable_water_entire_atmosphere |
kg/m^2 | 0* | 100* | 27,830 m | 大気全体の可降水量 |
u_component_of_wind_planetary_boundary_layer |
m/s | -66.8* | 62.18* | 27,830 m | 風の大気境界層の U 成分(2025 年 1 月 15 日から利用可能) |
v_component_of_wind_planetary_boundary_layer |
m/s | -63.08* | 57.6* | 27,830 m | 風の大気境界層の V 成分(2025 年 1 月 15 日から利用可能) |
gust |
m/s | 0* | 57.41* | 27,830 m | 風速(突風)(2025 年 1 月 15 日から利用可能) |
precipitation_rate |
kg/m^2/s | 0* | 0.032* | 27,830 m | 降水量(2025 年 1 月 15 日から利用可能) |
haines_index |
2* | 6* | 27,830 m | ヘインズ指数(2025 年 1 月 15 日以降に利用可能) |
|
ventilation_rate |
m^2/s | 0* | 234,000* | 27,830 m | 換気率(2025 年 1 月 15 日より利用可能) |
total_cloud_cover_entire_atmosphere |
% | 0* | 100* | 27,830 m | 大気全体の総雲量(以前は forecast_hours > 0 のアセットのみでしたが、2025 年 1 月 15 日以降は forecast_hours == 0 のアセットでも利用可能) |
downward_shortwave_radiation_flux |
W/m^2 | 0* | 1230* | 27,830 m | 下向き短波放射束(forecast_hours > 0 のアセットのみ) |
downward_longwave_radiation_flux |
W/m^2 | 0* | 100* | 27,830 m | 下向き長波放射束(2025 年 1 月 15 日から利用可能。ただし、forecast_hours > 0 のアセットのみ) |
upward_shortwave_radiation_flux |
W/m^2 | 0* | 1230* | 27,830 m | 上向き短波放射フラックス(2025 年 1 月 15 日以降に利用可能。ただし、forecast_hours > 0 のアセットのみ) |
upward_longwave_radiation_flux |
W/m^2 | 0* | 100* | 27,830 m | 上向き長波放射フラックス(2025 年 1 月 15 日以降に利用可能。ただし、forecast_hours > 0 のアセットのみ) |
planetary_boundary_layer_height |
m | 7.77* | 6,312.67* | 27,830 m | 大気境界層の高さ(2025 年 1 月 15 日以降に利用可能) |
画像プロパティ検出
画像プロパティ
| 名前 | タイプ | 説明 |
|---|---|---|
| creation_time | DOUBLE | 作成の日時 |
| forecast_hours | DOUBLE | 予測時間 |
| forecast_time | DOUBLE | 予測時間 |
利用規約
利用規約
NOAA のデータ、情報、プロダクトは、配信方法にかかわらず、著作権の対象ではなく、一般ユーザーによるその後の使用に制限はありません。取得したデータは、合法な目的であればどのような用途にも使用できます。上記のデータはパブリック ドメインであり、使用と配布に制限はありません。
引用
Alpert, J.、2006 Sub-Grid Scale Mountain Blocking at NCEP, 20th Conf. WAF/16 Conf. NWP P2.4.
Alpert、J. C.、S-Y。Hong、Y-J。Kim: 1996, Sensitivity of cyclogenesis to lower troposphere enhancement of gravity wave drag using the EMC MRF", Proc. 11 Conf. On NWP, Norfolk, 322-323.
Alpert,J,, M. Kanamitsu, P. M. Caplan, J. G. Sela, G. H. White、E. Kalnay、1988: Mountain induced gravity wave drag parameterization in the NMC medium-range forecast model. Pre-prints, Eighth Conf. on Numerical Weather Prediction, Baltimore, MD, Amer. Meteor. Soc.、726-733.
Buehner, M.、J. Morneau、および C. Charette、2013: Four-dimensional ensemble-variational data assimilation for global deterministic weather prediction. Nonlinear Processes Geophys., 20, 669-682.
Chun, H.-Y.、J.-J. Baik、1998 年: 熱誘起内部重力波による運動量フラックスと大規模モデルの近似。J. Atmos。Sci.、55, 3299-3310.
Chun, H.-Y.、Song, I.-S.、Baik, J.-J. and Y.-J. Kim。2004: Impact of a Convectively Forced Gravity Wave Drag Parameterization in NCAR CCM3. J. Climate, 17, 3530-3547.
Chun, H.-Y.、Song, M.-D.、Kim, J.-W.、J.-J. Baik、2001: 積雲対流によって誘発される重力波抗力が大気一般循環に及ぼす影響。J. Atmos。Sci.、58, 302-319.
Clough, S.A.、MW Shephard、EJ Mlawer、JS Delamere、MJ Iacono、K.Cady-Pereira、S. Boukabara、PD Brown、2005: 大気放射伝達モデリング: AER コードの概要、J. 数量Spectrosc. Radiat. Transfer, 91, 233-244. doi:10.1016/j.jqsrt.2004.05.058
Ebert, E.E., and J.A. Curry, 1992: A parameterization of ice cloud optical properties for climate models. J. Geophys. Res., 97, 3831-3836.
Fu, Q.、1996: An Accurate Parameterization of the Solar Radiative Properties of Cirrus Clouds for Climate Models. J. Climate, 9, 2058-2082.
Han, J.、H.-L. Pan、2006: Sensitivity of hurricane intensity forecast to convective momentum transport parameterization. 月曜。天気。Rev., 134, 664-674.
Han, J.、H.-L. Pan、2011: Revision of convection and vertical diffusion schemes in the NCEP global forecast system. Weather and Forecasting、26、520 ~ 533。
Han, J.、M. Witek, J. Teixeira, R. Sun, H.-L. Pan, J. K. Fletcher、C. S. Bretherton、2016: NCEP GFS における、散逸加熱と修正された安定境界層混合を伴うハイブリッド渦拡散質量流束(EDMF)境界層パラメータ化の実装。Weather and Forecasting、31、341-352。
Hou, Y.、S. Moorthi、K. Campana, 2002: Parameterization of Solar Radiation Transfer in the NCEP Models, NCEP Office Note #441, pp46. ファイルはこちら
Hu, Y.X.、K. Stamnes、1993: 気候モデルでの使用に適した水雲の放射特性の正確なパラメータ化。J. Climate、6、728-74。
Iacono, M.J.、E.J. Mlawer、S.A. Clough、J.-J. Morcrette、2000: 改良された長波放射モデル RRTM が NCAR コミュニティ気候モデル CCM3 のエネルギー収支と熱力学的特性に与える影響、J. Geophys. Res., 105(D11), 14,873-14,890.2.
Johansson, Ake, 2008: Convectively Forced Gravity Wave Drag in the NCEP Global Weather and Climate Forecast Systems, SAIC/Environmental Modelling Center internal report.
Juang, H-M, et al. 2014:Regional Spectral Model workshop in memory of John Roads and Masao Kanamitsu, BAMS, A. 満たしている。Soc、ES61 ~ ES65。
Kim, Y.-J.、A. Arakawa(1995)、メソスケール重力波モデルを使用した地形重力波パラメータ化の改善、J. Atmos。Sci.,52, 875-1902.
Kleist, D. T.、2012: An evaluation of hybrid variational-ensemble data assimilation for the NCEP GFS , Ph.D. Thesis, Dept. of Atmospheric and Oceanic Science, University of Maryland-College Park, 149 pp.
Lott, F and M. J. Miller: 1997, "A new subgrid-scale orographic drag parameterization: Its formulation and testing", QJRMS, 123, pp101-127.
Mlawer, E.J.、S.J. Taubman、P.D. Brown、M.J. Iacono、S.A. Clough、1997: Radiative transfer for inhomogeneous atmospheres: RRTM, a validated correlated-k model for the longwave. J. Geophys. Res., 102, 16663-16682.
Sela, J.、2009 年: GFS にシグマ圧力ハイブリッド座標を実装。NCEP Office Note #461、pp25。
Sela, J.、2010 年: GFS のシグマ圧力ハイブリッド座標セミラグランジュ モデル方程式の導出。NCEP Office Note #462 pp31.
Yang, F.、2009: NCEP GFS の負の水蒸気について: 発生源と解決策。23rd Conference on Weather Analysis and Forecasting/19th Conference on Numerical Weather Prediction, 1-5 June 2009, Omaha, NE.
Yang, F.、K. Mitchell, Y. Hou, Y. Dai, X. Zeng, Z. Wang, and X. Liang、2008: Dependence of land surface albedo on solar zenith angle: observations and model parameterizations. Journal of Applied Meteorology and Climatology.No.11, Vol 47, 2963-2982.
DOI
Earth Engine で探索する
コードエディタ(JavaScript)
var dataset = ee.ImageCollection('NOAA/GFS0P25')
                  .filter(ee.Filter.date('2018-03-01', '2018-03-02'));
var temperatureAboveGround = dataset.select('temperature_2m_above_ground');
var visParams = {
  min: -40.0,
  max: 35.0,
  palette: ['blue', 'purple', 'cyan', 'green', 'yellow', 'red'],
};
Map.setCenter(71.72, 52.48, 3.0);
Map.addLayer(temperatureAboveGround, visParams, 'Temperature Above Ground');
import ee
import geemap.core as geemap
Colab(Python)
dataset = ee.ImageCollection('NOAA/GFS0P25').filter(
    ee.Filter.date('2018-03-01', '2018-03-02')
)

temperature_above_ground = dataset.select('temperature_2m_above_ground')

vis_params = {
    'min': -40.0,
    'max': 35.0,
    'palette': ['blue', 'purple', 'cyan', 'green', 'yellow', 'red'],
}

m = geemap.Map()
m.set_center(71.72, 52.48, 3.0)
m.add_layer(temperature_above_ground, vis_params, 'Temperature Above Ground')
m