- Dataset Availability
- 1979-01-01T00:00:00Z–2026-06-20T12:00:00Z
- Dataset Producer
- NOAA NWS National Centers for Environmental Prediction (NCEP)
- Cadence
- 6 Hours
- Tags
Description
The National Centers for Environmental Prediction (NCEP) Climate Forecast System (CFS) is a fully coupled model representing the interaction between the Earth's atmosphere, oceans, land, and sea ice. CFS was developed at the Environmental Modeling Center (EMC) at NCEP. The operational CFS was upgraded to version 2 (CFSv2) on March 30, 2011.
Forecasts are initialized four times per day (0000, 0600, 1200, and 1800 UTC). This is the same model that was used to create the NCEP Climate Forecast System Reanalysis (CFSR), and the purpose of the CFSv2 dataset is to extend CFSR. We ingest only a subset of bands from files matching cdas1.t??z.sfluxgrbf06.grib2.
For more information about CFS, please see the CFS NOAA site.
This dataset harmonizes all temperature bands to Kelvin.
Bands
Bands
Pixel size: 22264 meters (all bands)
| Name | Units | Min | Max | Pixel Size | Description |
|---|---|---|---|---|---|
Downward_Long-Wave_Radp_Flux_surface_6_Hour_Average |
W/m^2 | 41.76* | 532.67* | 22264 meters | Downward long-wave radiation flux at surface, 6-hour average |
Downward_Short-Wave_Radiation_Flux_surface_6_Hour_Average |
W/m^2 | 0* | 1125.23* | 22264 meters | Downward short-wave radiation flux at surface, 6-hour average |
Geopotential_height_surface |
gpm | -292* | 5938.65* | 22264 meters | Geopotential height at surface |
Latent_heat_net_flux_surface_6_Hour_Average |
W/m^2 | -628* | 2357* | 22264 meters | Latent heat net flux at surface, 6-hour average |
Maximum_specific_humidity_at_2m_height_above_ground_6_Hour_Interval |
Mass fraction | 0* | 0.1* | 22264 meters | Maximum specific humidity 2m above ground, 6-hour interval |
Maximum_temperature_height_above_ground_6_Hour_Interval |
K | 189.8* | 334.89* | 22264 meters | Maximum temperature 2m above ground, 6-hour interval |
Minimum_specific_humidity_at_2m_height_above_ground_6_Hour_Interval |
Mass fraction | 0* | 0.02* | 22264 meters | Minimum specific humidity 2m above ground, 6-hour interval |
Minimum_temperature_height_above_ground_6_Hour_Interval |
K | 188.39* | 324.39* | 22264 meters | Minimum temperature 2m above ground, 6-hour interval |
Potential_Evaporation_Rate_surface_6_Hour_Average |
W/m^2 | -202* | 6277* | 22264 meters | Potential evaporation rate at surface, 6-hour average |
Precipitation_rate_surface_6_Hour_Average |
kg/m^2/s | 0* | 0.03* | 22264 meters | Precipitation rate at surface, 6-hour average |
Pressure_surface |
Pa | 47200* | 109180* | 22264 meters | Pressure at surface |
Sensible_heat_net_flux_surface_6_Hour_Average |
W/m^2 | -2295* | 3112* | 22264 meters | Sensible heat net flux at surface, 6-hour average |
Specific_humidity_height_above_ground |
Mass fraction | 0* | 0.06* | 22264 meters | Specific humidity 2m above ground |
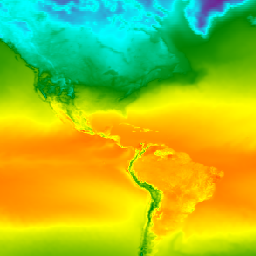
Temperature_height_above_ground |
K | 188.96* | 328.68* | 22264 meters | Temperature 2m above ground |
u-component_of_wind_height_above_ground |
m/s | -57.2* | 57.99* | 22264 meters | U-component of wind 10m above ground |
Upward_Long-Wave_Radp_Flux_surface_6_Hour_Average |
W/m^2 | 59* | 757* | 22264 meters | Upward long-wave radiation flux at surface, 6-hour average |
Upward_Short-Wave_Radiation_Flux_surface_6_Hour_Average |
W/m^2 | 0* | 812* | 22264 meters | Upward short-wave radiation flux at surface, 6-hour average |
v-component_of_wind_height_above_ground |
m/s | -53.09* | 57.11* | 22264 meters | V-component of wind 10m above ground |
Volumetric_Soil_Moisture_Content_depth_below_surface_layer_5_cm |
Fraction | 0.02* | 1* | 22264 meters | Volumetric soil moisture content 5cm below surface layer |
Volumetric_Soil_Moisture_Content_depth_below_surface_layer_25_cm |
Fraction | 0.02* | 1* | 22264 meters | Volumetric soil moisture content 25cm below surface layer |
Volumetric_Soil_Moisture_Content_depth_below_surface_layer_70_cm |
Fraction | 0.02* | 1* | 22264 meters | Volumetric soil moisture content 70cm below surface layer |
Volumetric_Soil_Moisture_Content_depth_below_surface_layer_150_cm |
Fraction | 0.02* | 1* | 22264 meters | Volumetric soil moisture content 150cm below surface layer |
Image Properties
Image Properties
| Name | Type | Description |
|---|---|---|
| end_hour | DOUBLE | End hour |
| start_hour | DOUBLE | Start hour |
Terms of Use
Terms of Use
NOAA data, information, and products, regardless of the method of delivery, are not subject to copyright and carry no restrictions on their subsequent use by the public. Once obtained, they may be put to any lawful use. The forgoing data is in the public domain and is being provided without restriction on use and distribution. For more information visit the NWS disclaimer site.
Citations
Saha, S., et al. 2011, updated daily. NCEP Climate Forecast System Version 2 (CFSv2) 6-hourly Products. Research Data Archive at the National Center for Atmospheric Research, Computational and Information Systems Laboratory. https://doi.org/10.5065/D61C1TXF. Accessed dd mmm yyyy.
DOIs
Explore with Earth Engine
Code Editor (JavaScript)
var dataset = ee.ImageCollection('NOAA/CFSV2/FOR6H_HARMONIZED')
                  .filter(ee.Filter.date('2018-03-01', '2018-03-14'));
var temperatureAboveGround = dataset.select('Temperature_height_above_ground');
var visParams = {
  min: 220.0,
  max: 310.0,
  palette: ['blue', 'purple', 'cyan', 'green', 'yellow', 'red'],
};
Map.setCenter(-88.6, 26.4, 1);
Map.addLayer(temperatureAboveGround, visParams, 'Temperature Above Ground');