
- ความพร้อมใช้งานของชุดข้อมูล
- 2015-04-02T12:00:00Z–2022-08-02T12:00:00Z
- ผู้ผลิตชุดข้อมูล
- NASA GSFC
- รอบขา
- 3 วัน
- แท็ก
คำอธิบาย
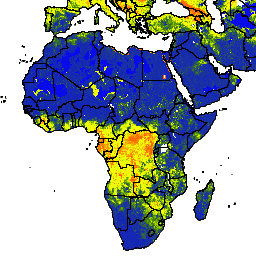
ข้อมูลความชื้นในดินทั่วโลกของ SMAP ที่ปรับปรุงแล้วของ NASA-USDA ให้ข้อมูลความชื้นในดินทั่วโลกที่ความละเอียดเชิงพื้นที่ 10 กม. ชุดข้อมูลนี้ประกอบด้วยความชื้นในดินที่พื้นผิวและใต้พื้นผิว (มม.), โปรไฟล์ความชื้นในดิน (%) รวมถึงความผิดปกติของความชื้นในดินที่พื้นผิวและใต้พื้นผิว (-)
ชุดข้อมูลนี้สร้างขึ้นโดยการผสานรวมข้อมูลการสังเกตความชื้นในดินระดับ 3 ของดาวเทียม Soil Moisture Active Passive (SMAP) เข้ากับโมเดล Palmer แบบ 2 ชั้นที่ปรับเปลี่ยนแล้วโดยใช้แนวทางการดูดซึมข้อมูล 1-D Ensemble Kalman Filter (EnKF) ความผิดปกติของความชื้นในดินคำนวณจากสภาพอากาศของวันที่มีความสนใจ สภาพอากาศโดยเฉลี่ยคำนวณโดยอิงตามบันทึกข้อมูลทั้งหมดของการสังเกตการณ์จากดาวเทียม SMAP และแนวทางหน้าต่างเคลื่อนที่แบบ 31 วัน การดูดซึมข้อมูลการสังเกตความชื้นในดินของ SMAP ช่วยปรับปรุงการคาดการณ์ความชื้นในดินตามโมเดล โดยเฉพาะอย่างยิ่งในพื้นที่ที่มีเครื่องมือไม่ดีพอทั่วโลกซึ่งขาดข้อมูลปริมาณน้ำฝนที่มีคุณภาพ
ชุดข้อมูลนี้พัฒนาขึ้นโดยห้องปฏิบัติการวิทยาศาสตร์อุทกวิทยาที่ศูนย์การบินอวกาศก็อดดาร์ดของ NASA ร่วมกับ USDA Foreign Agricultural Services และ USDA Hydrology and Remote Sensing Lab
ย่านความถี่
ย่านความถี่
ขนาดพิกเซล: 10,000 เมตร (ทุกย่านความถี่)
| ชื่อ | หน่วย | ต่ำสุด | สูงสุด | ขนาดพิกเซล | คำอธิบาย |
|---|---|---|---|---|---|
ssm |
มม. | 0* | 25.39* | 10,000 เมตร | ความชื้นในดินที่พื้นผิว |
susm |
มม. | 0* | 274.6* | 10,000 เมตร | ความชื้นในดินใต้พื้นผิว |
smp |
เศษส่วน | 0* | 1* | 10,000 เมตร | โปรไฟล์ความชื้นในดิน |
ssma |
ไม่มีหน่วย | -4* | 4* | 10,000 เมตร | ความผิดปกติของความชื้นในดินที่พื้นผิว |
susma |
ไม่มีหน่วย | -4* | 4* | 10,000 เมตร | ความผิดปกติของความชื้นในดินใต้พื้นผิว |
ข้อกำหนดในการใช้งาน
ข้อกำหนดในการใช้งาน
ชุดข้อมูลนี้เป็นสาธารณสมบัติและพร้อมใช้งานโดยไม่มีข้อจำกัดในการใช้งานและการเผยแพร่ ดูข้อมูลเพิ่มเติมได้ที่นโยบายข้อมูลและวิทยาศาสตร์โลกของ NASA
การอ้างอิง
Sazib, N., J. D. Bolten, and I. E. Mladenova. 2021 Leveraging NASA Soil Moisture Active Passive for Assessing Fire Susceptibility and Potential Impacts Over Australia and California. IEEE Journal of Selected Topics in Applied Earth Observations and Remote Sensing, 15: 779-787. doi:10.1109/jstars.2021.3136756
Mladenova, I.E., Bolten, J.D., Crow, W., Sazib, N. and Reynolds, C., 2020 Agricultural drought monitoring via the assimilation of SMAP soil moisture retrievals into a global soil water balance model. Front. Big Data, 3(10). doi:10.3389/fdata.2020.00010
Sazib, N., J. D. Bolten, and I. E. Mladenova. 2021 Leveraging NASA Soil Moisture Active Passive for Assessing Fire Susceptibility and Potential Impacts Over Australia and California. IEEE Journal of Selected Topics in Applied Earth Observations and Remote Sensing, 15: 779-787. doi:10.1109/jstars.2021.3136756
Mladenova, I.E., Bolten, J.D., Crow, W.T., Sazib, N., Cosh, M.H., Tucker, C.J. and Reynolds, C., 2019 Evaluating the operational application of SMAP for global agricultural drought monitoring. IEEE Journal of Selected Topics in Applied Earth Observations and Remote Sensing, 12(9): 3387-3397. doi:10.1109/JSTARS.2019.2923555
Sazib, N., Mladenova, I., &Bolten, J. (2020). Assessing the Impact of ENSO on Agriculture over Africa using Earth Observation Data. Frontiers in Sustainable Food Systems, 4, 188. doi:10.3389/fsufs.2020.509914 Google Scholar
Sazib, N., Mladenova, I. and Bolten, J., 2018 Leveraging the google earth engine for drought assessment using global soil moisture data. Remote sensing, 10(8): 1265. doi:10.3390/rs10081265
Bolten, J., W.T. Crow, X. Zhan, T.J. Jackson, and C.A. Reynolds (2010). Evaluating the Utility of Remotely Sensed Soil Moisture Retrievals for Operational Agricultural Drought Monitoring, IEEE Transactions on Geoscience and Remote Sensing, 3(1): 57-66. doi:10.1109/JSTARS.2009.2037163 Google Scholar
Bolten, J., and W. T. Crow (2012). Improved prediction of quasi-global vegetation conditions using remotely sensed surface soil moisture, Geophysical Research Letters, 39: (L19406). [doi:10.1029/2012GL053470][https://doi.org/10.1029/2012GL053470) Google Scholar
Entekhabi, D, Njoku, EG, O'Neill, PE, Kellogg, KH, Crow, WT, Edelstein, WN, Entin, JK, Goodman, SD, Jackson, TJ, Johnson, J, Kimball, J, Piepmeier, JR, Koster, RD, Martin, N, McDonald, KC, Moghaddam, M, Moran, S, Reichle, R, Shi, JC, Spencer, MW, Thurman, SW, Tsang, L & Van Zyl, J (2010). The soil moisture active passive (SMAP) mission, Proceedings of the IEEE, 98(5): 704-716. doi:10.1109/JPROC.2010.2043918
I. E. Mladenova, J.D. Bolten, W.T. Crow, M.C. Anderson, C.R. Hain, D.M. Johnson, R. Mueller (2017). Intercomparison of Soil Moisture, Evaporative Stress, and Vegetation Indices for Estimating Corn and Soybean Yields Over the U.S., IEEE Journal of Selected Topics in Applied Earth Observations and Remote Sensing, 10(4): 1328-1343. doi:10.1109/JSTARS.2016.2639338
O'Neill, P. E., S. Chan, E. G. Njoku, T. Jackson, and R. Bindlish (2016). SMAP L3 Radiometer Global Daily 36 km EASE-Grid Soil Moisture, Version 4. Boulder, Colorado USA. NASA National Snow and Ice Data Center Distributed Active Archive Center.doi:10.5067/ZX7YX2Y2LHEB
DOI
- https://doi.org/10.1029/2012GL053470
- https://doi.org/10.1109/JPROC.2010.2043918
- https://doi.org/10.1109/JSTARS.2009.2037163
- https://doi.org/10.1109/JSTARS.2016.2639338
- https://doi.org/10.1109/JSTARS.2019.2923555
- https://doi.org/10.1109/jstars.2021.3136756
- https://doi.org/10.3389/fsufs.2020.509914
- https://doi.org/10.3390/rs10081265
- https://doi.org/10.5067/ZX7YX2Y2LHEB
สำรวจด้วย Earth Engine
ตัวแก้ไขโค้ด (JavaScript)
var dataset = ee.ImageCollection('NASA_USDA/HSL/SMAP10KM_soil_moisture')
                  .filter(ee.Filter.date('2017-04-01', '2017-04-30'));
var soilMoisture = dataset.select('ssm');
var soilMoistureVis = {
  min: 0.0,
  max: 28.0,
  palette: ['0300ff', '418504', 'efff07', 'efff07', 'ff0303'],
};
Map.setCenter(-6.746, 46.529, 2);
Map.addLayer(soilMoisture, soilMoistureVis, 'Soil Moisture');
import ee
import geemap.core as geemap
Colab (Python)
dataset = ee.ImageCollection('NASA_USDA/HSL/SMAP10KM_soil_moisture').filter(
    ee.Filter.date('2017-04-01', '2017-04-30')
)

soil_moisture = dataset.select('ssm')

soil_moisture_vis = {
    'min': 0.0,
    'max': 28.0,
    'palette': ['0300ff', '418504', 'efff07', 'efff07', 'ff0303'],
}

m = geemap.Map()
m.set_center(-6.746, 46.529, 2)
m.add_layer(soil_moisture, soil_moisture_vis, 'Soil Moisture')
m