Page Summary
-
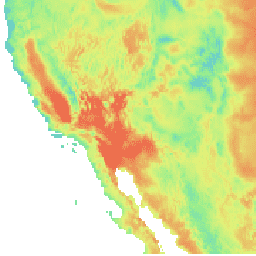
The NLDAS-2 dataset provides hourly estimates of climatological properties using a combination of observation sources.
-
This dataset is the primary forcing file for Phase 2 of the North American Land Data Assimilation System with a 1/8th-degree grid spacing.
-
The dataset includes bands for various parameters such as temperature, humidity, pressure, wind components, radiation, precipitation, and soil-related properties.
-
Data from this dataset are available free to the user community, consistent with NASA's Earth Science Data and Information Policy.
- Dataset Availability
- 1979-01-01T13:00:00Z–2026-06-08T12:00:00Z
- Dataset Producer
- NASA GES DISC at NASA Goddard Space Flight Center
- Cadence
- 1 Hour
- Tags
Description
Land Data Assimilation System (LDAS) combines multiple sources of observations (such as precipitation gauge data, satellite data, and radar precipitation measurements) to produce estimates of climatological properties at or near the Earth''s surface.
This dataset is the primary (default) forcing file (File A) for Phase 2 of the North American Land Data Assimilation System (NLDAS-2). The data are in 1/8th-degree grid spacing; the temporal resolution is hourly.
NLDAS is a collaboration project among several groups: NOAA/NCEP''s Environmental Modeling Center (EMC), NASA''s Goddard Space Flight Center (GSFC), Princeton University, the University of Washington, the NOAA/NWS Office of Hydrological Development (OHD), and the NOAA/NCEP Climate Prediction Center (CPC). NLDAS is a core project with support from NOAA''s Climate Prediction Program for the Americas (CPPA).
Documentation:
Bands
Bands
Pixel size: 13915 meters (all bands)
| Name | Units | Min | Max | Pixel Size | Description |
|---|---|---|---|---|---|
temperature |
°C | -49.79* | 51.2* | 13915 meters | Air temperature at 2 meters above the surface |
specific_humidity |
Mass fraction | 0* | 0.02* | 13915 meters | Specific humidity at 2 meters above the surface |
pressure |
Pa | 61847.6* | 105338* | 13915 meters | Surface pressure |
wind_u |
m/s | -27.93* | 27.54* | 13915 meters | U wind component at 10 meters above the surface |
wind_v |
m/s | -27.45* | 35.13* | 13915 meters | V wind component at 10 meters above the surface |
longwave_radiation |
W/m^2 | 72.18* | 545.11* | 13915 meters | Surface downward longwave radiation |
convective_fraction |
0* | 1* | 13915 meters | Fraction of total precipitation that is convective: from NARR |
|
potential_energy |
J/kg | 0* | 76666.2* | 13915 meters | Convective available potential energy (J/kg): from NARR |
potential_evaporation |
kg/m^2 | 0* | 2.76* | 13915 meters | Potential evaporation: from NARR |
total_precipitation |
kg/m^2 | 0* | 124.19* | 13915 meters | Hourly total precipitation |
shortwave_radiation |
W/m^2 | 0* | 1368.54* | 13915 meters | Surface downward shortwave radiation - bias corrected |
Image Properties
Image Properties
| Name | Type | Description |
|---|---|---|
| end_hour | DOUBLE | End hour |
| start_hour | DOUBLE | Start hour |
Terms of Use
Terms of Use
Distribution of data from the Goddard Earth Sciences Data and Information Services Center (GES DISC) is funded by NASA's Science Mission Directorate (SMD). Consistent with NASA Earth Science Data and Information Policy, data from the GES DISC archive are available free to the user community. For more information visit the GES DISC Data Policy page.
Citations
The data set source should be properly cited when the data are used. A formal reference of the form: \
. NASA/GSFC, Greenbelt, MD, USA, NASA Goddard Earth Sciences Data and Information Services Center (GES DISC). Accessed \ at \
Explore with Earth Engine
Code Editor (JavaScript)
var dataset = ee.ImageCollection('NASA/NLDAS/FORA0125_H002')
                  .filter(ee.Filter.date('2018-07-01', '2018-07-30'));
var temperature = dataset.select('temperature');
var temperatureVis = {
  min: -5.0,
  max: 40.0,
  palette: ['3d2bd8', '4e86da', '62c7d8', '91ed90', 'e4f178', 'ed6a4c'],
};
Map.setCenter(-110.21, 35.1, 4);
Map.addLayer(temperature, temperatureVis, 'Temperature');