Page Summary
-
The NASA NEX-DCP30 dataset provides downscaled climate scenarios for the conterminous United States from 1950 to 2099.
-
This dataset is derived from CMIP5 GCM runs and IPCC AR5 RCPs to evaluate climate change impacts at finer scales.
-
It contains monthly projections including ensemble statistics for precipitation and minimum/maximum near-surface air temperature.
-
The dataset is publicly available and provided by the Climate Analytics Group and NASA Ames Research Center.
- Dataset Availability
- 1950-01-01T00:00:00Z–2099-12-01T00:00:00Z
- Dataset Producer
- NASA / Climate Analytics Group
- Cadence
- 1 Month
- Tags
Description
The NASA NEX-DCP30 dataset is comprised of downscaled climate scenarios for the conterminous United States that are derived from the General Circulation Model (GCM) runs conducted under the Coupled Model Intercomparison Project Phase 5 (CMIP5, see Taylor et al. 2012) and across the four greenhouse gas emissions scenarios known as Representative Concentration Pathways (RCPs, see Meinshausen et al. 2011) developed for the Fifth Assessment Report of the Intergovernmental Panel on Climate Change (IPCC AR5). The purpose of these datasets is to provide a set of high resolution, bias-corrected climate change projections that can be used to evaluate climate change impacts on processes that are sensitive to finer-scale climate gradients and the effects of local topography on climate conditions.
The dataset contains monthly projections covering the periods from 1950 through 2005 (Retrospective Run) and from 2006 to 2099 (Prospective Run). It includes ensemble statistics calculated for each RCP from all model runs available for the pr, tasmin, and tasmax bands.
NEX-DCP30 was prepared by the Climate Analytics Group and NASA Ames Research Center using the NASA Earth Exchange, and distributed by the NASA Center for Climate Simulation (NCCS).
Bands
Bands
Pixel size: 927.67 meters (all bands)
| Name | Units | Min | Max | Pixel Size | Description |
|---|---|---|---|---|---|
pr_mean |
kg/m^2/s | 0* | 0.0006* | 927.67 meters | Monthly mean of the daily precipitation rate at surface; includes both liquid and solid phases from all types of clouds (both large-scale and convective) |
pr_quartile25 |
kg/m^2/s | 0* | 0.0004* | 927.67 meters | 25th quartile of the precipitation at surface; includes both liquid and solid phases from all types of clouds (both large-scale and convective) |
pr_median |
kg/m^2/s | 0* | 0.0006* | 927.67 meters | Median of precipitation at surface; includes both liquid and solid phases from all types of clouds (both large-scale and convective) |
pr_quartile75 |
kg/m^2/s | 0* | 0.0008* | 927.67 meters | 75th quartile of the precipitation at surface; includes both liquid and solid phases from all types of clouds (both large-scale and convective) |
tasmin_mean |
K | 247.58* | 311.09* | 927.67 meters | Monthly mean of the daily-minimum near-surface air temperature |
tasmin_quartile25 |
K | 243.28* | 310.06* | 927.67 meters | 25th quartile the daily-minimum near-surface air temperature |
tasmin_median |
K | 246.87* | 311.12* | 927.67 meters | Median of the daily-minimum near-surface air temperature |
tasmin_quartile75 |
K | 248.42* | 312.59* | 927.67 meters | 75th quartile of the daily-minimum near-surface air temperature |
tasmax_mean |
K | 258.47* | 326.48* | 927.67 meters | Monthly mean of the daily-maximum near-surface air temperature |
tasmax_quartile25 |
K | 256.13* | 325.52* | 927.67 meters | 25th quartile of the daily-maximum near-surface air temperature |
tasmax_median |
K | 257.89* | 326.28* | 927.67 meters | Median of the daily-maximum near-surface air temperature |
tasmax_quartile75 |
K | 260.2* | 328.2* | 927.67 meters | 75th quartile of the daily-maximum near-surface air temperature |
Image Properties
Image Properties
| Name | Type | Description |
|---|---|---|
| scenario | STRING | Name of the CMIP5 scenario. It is one of: 'historical', 'rcp26', 'rcp45', 'rcp60', 'rcp85', where 'historical' designates retrospective model runs (pre-2006). |
| month | DOUBLE | Calendar month |
Terms of Use
Terms of Use
This dataset is in the public domain and is available without restriction on use and distribution. See NASA's Earth Science Data & Information Policy for additional information.
Citations
Thrasher, B., J. Xiong, W. Wang, F. Melton, A. Michaelis and R. Nemani (2013), Downscaled Climate Projections Suitable for Resource Management, Eos Trans. AGU, 94(37), 321. doi:10.1002/2013EO370002
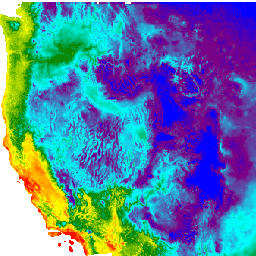
Explore with Earth Engine
Code Editor (JavaScript)
var dataset = ee.ImageCollection('NASA/NEX-DCP30_ENSEMBLE_STATS')
                  .filter(ee.Filter.date('2018-07-01', '2018-07-30'));
var monthlyMeanMinimumAirTemperature = dataset.select('tasmin_mean');
var monthlyMeanMinimumAirTemperatureVis = {
  min: 247.0,
  max: 311.0,
  palette: ['blue', 'purple', 'cyan', 'green', 'yellow', 'red'],
};
Map.setCenter(-115.356, 38.686, 5);
Map.addLayer(
    monthlyMeanMinimumAirTemperature, monthlyMeanMinimumAirTemperatureVis,
    'Monthly Mean Minimum Air Temperature');