Page Summary
-
The dataset covers a wide range of meteorological diagnostics at various vertical levels, including temperature, wind, and pressure.
-
Data is available hourly from 1980 to 2025 and is provided by NASA/MERRA.
-
This dataset is part of the MERRA-2 global atmospheric reanalysis product.
-
The data is intended for research, education, and non-profit use through the Earth Engine platform.
- Dataset Availability
- 1980-01-01T00:00:00Z–2026-05-01T23:00:00Z
- Dataset Producer
- NASA/MERRA
- Cadence
- 1 Hour
- Tags
Description
M2T1NXSLV (or tavg1_2d_slv_Nx) is an hourly time-averaged 2-dimensional data collection in Modern-Era Retrospective analysis for Research and Applications version 2 (MERRA-2). This collection consists of meteorology diagnostics at popularly used vertical levels, such as air temperature at 2-meter (or at 10-meter, 850hPa, 500 hPa, 250hPa), wind components at 50-meter (or at 2-meter, 10-meter, 850 hPa, 500hPa, 250 hPa), sea level pressure, surface pressure, and total precipitable water vapor (or ice water, liquid water). The data field is time-stamped with the central time of an hour starting from 00:30 UTC, e.g.: 00:30, 01:30, ... , 23:30 UTC.
MERRA-2 is the latest version of global atmospheric reanalysis for the satellite era produced by NASA Global Modeling and Assimilation Office (GMAO) using the Goddard Earth Observing System Model (GEOS) version 5.12.4. The dataset covers the period of 1980-present with the latency of ~3 weeks after the end of a month.
Bands
Bands
Pixel size: 69375x55000 meters (all bands)
| Name | Units | Pixel Size | Description |
|---|---|---|---|
CLDPRS |
Pa | 69375x55000 meters | Cloud top pressure |
CLDTMP |
K | 69375x55000 meters | Cloud top temperature |
DISPH |
m | 69375x55000 meters | Zero plane displacement height |
H1000 |
m | 69375x55000 meters | Height at 1000 mb |
H250 |
m | 69375x55000 meters | Height at 250 hPa |
H500 |
m | 69375x55000 meters | Height at 500 hPa |
H850 |
m | 69375x55000 meters | Height at 850 hPa |
OMEGA500 |
Pa/s | 69375x55000 meters | Omega at 500 hPa |
PBLTOP |
Pa | 69375x55000 meters | Pbltop pressure |
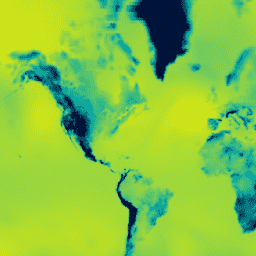
PS |
Pa | 69375x55000 meters | Surface pressure |
Q250 |
Mass fraction | 69375x55000 meters | Specific humidity at 250 hPa |
Q500 |
Mass fraction | 69375x55000 meters | Specific humidity at 500 hPa |
Q850 |
Mass fraction | 69375x55000 meters | Specific humidity at 850 hPa |
QV10M |
Mass fraction | 69375x55000 meters | 10-meter specific humidity |
QV2M |
Mass fraction | 69375x55000 meters | 2-meter specific humidity |
SLP |
Pa | 69375x55000 meters | Sea level pressure |
T10M |
K | 69375x55000 meters | 10-meter air temperature |
T250 |
K | 69375x55000 meters | Air temperature at 250 hPa |
T2MDEW |
K | 69375x55000 meters | Dew point temperature at 2 m |
T2MWET |
K | 69375x55000 meters | Wet bulb temperature at 2 m |
T2M |
K | 69375x55000 meters | 2-meter air temperature |
T500 |
K | 69375x55000 meters | Air temperature at 500 hPa |
T850 |
K | 69375x55000 meters | Air temperature at 850 hPa |
TO3 |
Dobson | 69375x55000 meters | Total column ozone |
TOX |
kg/m^2 | 69375x55000 meters | Total column odd oxygen |
TQI |
kg/m^2 | 69375x55000 meters | Total precipitable ice water |
TQL |
kg/m^2 | 69375x55000 meters | Total precipitable liquid water |
TQV |
kg/m^2 | 69375x55000 meters | Total precipitable water vapor |
TROPPB |
Pa | 69375x55000 meters | Tropopause pressure (TROPP) based on blended estimate |
TROPPT |
Pa | 69375x55000 meters | Tropopause pressure based on thermal estimate |
TROPPV |
Pa | 69375x55000 meters | Tropopause pressure based on epv estimate |
TROPQ |
Mass fraction | 69375x55000 meters | Tropopause specific humidity using blended tropp (TROPPB) estimate |
TROPT |
K | 69375x55000 meters | Tropopause temperature using blended tropp estimate |
TS |
K | 69375x55000 meters | Surface skin temperature |
U10M |
m/s | 69375x55000 meters | 10-meter eastward wind |
U250 |
m/s | 69375x55000 meters | Eastward wind at 250 hPa |
U2M |
m/s | 69375x55000 meters | 2-meter eastward wind |
U500 |
m/s | 69375x55000 meters | Eastward wind at 500 hPa |
U50M |
m/s | 69375x55000 meters | Eastward wind at 50 meters |
U850 |
m/s | 69375x55000 meters | Eastward wind at 850 hPa |
V10M |
m/s | 69375x55000 meters | 10-meter northward wind |
V250 |
m/s | 69375x55000 meters | Northward wind at 250 hPa |
V2M |
m/s | 69375x55000 meters | 2-meter northward wind |
V500 |
m/s | 69375x55000 meters | Northward wind at 500 hPa |
V50M |
m/s | 69375x55000 meters | Northward wind at 50 meters |
V850 |
m/s | 69375x55000 meters | Northward wind at 850 hPa |
ZLCL |
m | 69375x55000 meters | Lifting condensation level |
Terms of Use
Terms of Use
NASA promotes the full and open sharing of all data with research and applications communities, private industry, academia, and the general public.
Explore with Earth Engine
Code Editor (JavaScript)
var dataset = ee.ImageCollection('NASA/GSFC/MERRA/slv/2')
                  .filter(ee.Filter.date('2022-02-01', '2022-02-02'));
var surface_pressure = dataset.select('PS');
var surface_pressure_vis = {
  min: 81100,
  max: 117000,
  palette: ['001137', '01abab', 'e7eb05', '620500']
};
Map.setCenter(-95.62, 39.91, 2);
Map.addLayer(surface_pressure, surface_pressure_vis);