Page Summary
-
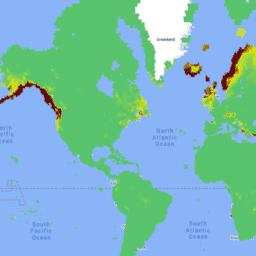
The M2T1NXLND dataset, part of MERRA-2, provides hourly time-averaged land surface diagnostics.
-
It includes data on baseflow flux, runoff, soil wetness, soil water layers, and soil temperature at six layers.
-
The dataset covers the period from 1980 to the present with hourly cadence.
-
MERRA-2 is the latest global atmospheric reanalysis produced by NASA GMAO using the GEOS model version 5.12.4.
-
This dataset is available through Google Earth Engine and adheres to NASA's open data sharing policy.
- Dataset Availability
- 1980-01-01T00:00:00Z–2026-05-01T23:00:00Z
- Dataset Producer
- NASA/MERRA
- Cadence
- 1 Hour
- Tags
Description
M2T1NXLND (or tavg1_2d_lnd_Nx) is an hourly time-averaged data collection in Modern-Era Retrospective analysis for Research and Applications version 2 (MERRA-2). This collection consists of land surface diagnostics, such a baseflow flux, runoff, surface soil wetness, root zone soil wetness, water at surface layer, water at root zone layer, and soil temperature at six layers. The data field is time-stamped with the central time of an hour starting from 00:30 UTC, e.g.: 00:30, 01:30, ... , 23:30 UTC.
MERRA-2 is the latest version of global atmospheric reanalysis for the satellite era produced by NASA Global Modeling and Assimilation Office (GMAO) using the Goddard Earth Observing System Model (GEOS) version 5.12.4. The dataset covers the period of 1980-present with the latency of ~3 weeks after the end of a month.
Bands
Bands
Pixel size: 69375x55000 meters (all bands)
| Name | Units | Min | Max | Pixel Size | Description |
|---|---|---|---|---|---|
BASEFLOW |
kg/m^2/s | 0* | 0.000129* | 69375x55000 meters | Baseflow flux |
ECHANGE |
W/m^2 | -2930.42* | 689.084* | 69375x55000 meters | Rate of change of total land energy |
EVLAND |
kg/m^2/s | -0.00011* | 0.000682* | 69375x55000 meters | Evaporation land |
EVPINTR |
W/m^2 | -55.2571* | 582.82* | 69375x55000 meters | Interception loss energy flux |
EVPSBLN |
W/m^2 | -310.134* | 729.17* | 69375x55000 meters | Snow ice evaporation energy flux |
EVPSOIL |
W/m^2 | -0.588216* | 1217.36* | 69375x55000 meters | Baresoil evaporation energy flux |
EVPTRNS |
W/m^2 | -0.882528* | 1635.84* | 69375x55000 meters | Transpiration energy flux |
FRSAT |
0* | 0.983076* | 69375x55000 meters | Fractional area of saturated zone |
|
FRSNO |
0* | 1* | 69375x55000 meters | Fractional area of land snowcover |
|
FRUNST |
0* | 0.999996* | 69375x55000 meters | Fractional area of unsaturated zone |
|
FRWLT |
0* | 1* | 69375x55000 meters | Fractional area of wilting zone |
|
GHLAND |
W/m^2 | -245.165* | 304.675* | 69375x55000 meters | Ground heating land |
GRN |
0* | 0.990087* | 69375x55000 meters | Greeness fraction |
|
GWETPROF |
0.086402* | 0.99997* | 69375x55000 meters | Average prof soil moisture |
|
GWETROOT |
0.085486* | 1* | 69375x55000 meters | Root zone soil wetness |
|
GWETTOP |
0.010069* | 1* | 69375x55000 meters | Surface soil wetness |
|
LAI |
0* | 8.07408* | 69375x55000 meters | Leaf area index |
|
LHLAND |
W/m^2 | -308.962* | 1682.57* | 69375x55000 meters | Latent heat flux land |
LWLAND |
W/m^2 | -318.505* | 47.5398* | 69375x55000 meters | Net longwave land |
PARDFLAND |
W/m^2 | 0* | 277.006* | 69375x55000 meters | Surface downwelling photosynthetic active radiation diffuse flux |
PARDRLAND |
W/m^2 | 0* | 441.662* | 69375x55000 meters | Surface downwelling par beam flux |
PRECSNOLAND |
kg/m^2/s | 0* | 0.008119* | 69375x55000 meters | Snowfall land |
PRECTOTLAND |
kg/m^2/s | 0* | 0.110576* | 69375x55000 meters | Total precipitation land |
PRMC |
Volume fraction | 0.032228* | 0.476084* | 69375x55000 meters | Water profile |
QINFIL |
kg/m^2/s | 0* | 0.012518* | 69375x55000 meters | Soil water infiltration rate |
RUNOFF |
kg/m^2/s | 0* | 0.104504* | 69375x55000 meters | Overland runoff including throughflow |
RZMC |
Volume fraction | 0.031886* | 0.478268* | 69375x55000 meters | Water root zone |
SFMC |
Volume fraction | 0.003945* | 0.478* | 69375x55000 meters | Water surface layer |
SHLAND |
W/m^2 | -1189.34* | 768.706* | 69375x55000 meters | Sensible heat flux land |
SMLAND |
kg/m^2/s | 0* | 0.007922* | 69375x55000 meters | Snowmelt flux land |
SNODP |
m | 0* | 9.30012* | 69375x55000 meters | Snow depth |
SNOMAS |
kg/m^2 | 0* | 3964.6* | 69375x55000 meters | Total snow storage land |
SPLAND |
W/m^2 | -71.822* | 754.467* | 69375x55000 meters | Rate of spurious land energy source |
SPSNOW |
W/m^2 | -1287.32* | 127.015* | 69375x55000 meters | Rate of spurious snow energy |
SPWATR |
kg/m^2/s | -0.000305* | 2e-06* | 69375x55000 meters | Rate of spurious land water source |
SWLAND |
W/m^2 | 0* | 1076.59* | 69375x55000 meters | Net shortwave land |
TELAND |
J/m^2 | -2.06745e+09* | 1.09445e+09* | 69375x55000 meters | Total energy storage land |
TPSNOW |
K | 207.984* | 273.16* | 69375x55000 meters | Surface temperature of snow |
TSAT |
K | 231.971* | 319.16* | 69375x55000 meters | Surface temperature of saturated zone |
TSOIL1 |
K | 235.694* | 326.169* | 69375x55000 meters | Soil temperatures layer 1 |
TSOIL2 |
K | 236.821* | 317.313* | 69375x55000 meters | Soil temperatures layer 2 |
TSOIL3 |
K | 238.6* | 314.921* | 69375x55000 meters | Soil temperatures layer 3 |
TSOIL4 |
K | 241.158* | 313.186* | 69375x55000 meters | Soil temperatures layer 4 |
TSOIL5 |
K | 244.4* | 311.295* | 69375x55000 meters | Soil temperatures layer 5 |
TSOIL6 |
K | 249.436* | 309.734* | 69375x55000 meters | Soil temperatures layer 6 |
TSURF |
K | 207.984* | 341.939* | 69375x55000 meters | Surface temperature of land incl snow |
TUNST |
K | 231.303* | 341.938* | 69375x55000 meters | Surface temperature of unsaturated zone |
TWLAND |
kg/m^2 | 42.9657* | 4430.25* | 69375x55000 meters | Available water storage land |
TWLT |
K | 231.303* | 341.939* | 69375x55000 meters | Surface temperature of wilted zone |
WCHANGE |
kg/m^2/s | -0.001769* | 0.012293* | 69375x55000 meters | Rate of change of total land water |
Terms of Use
Terms of Use
NASA promotes the full and open sharing of all data with research and applications communities, private industry, academia, and the general public.
Explore with Earth Engine
Code Editor (JavaScript)
var dataset = ee.ImageCollection('NASA/GSFC/MERRA/lnd/2')
                  .filter(ee.Filter.date('2022-02-01', '2022-02-02'));
var baseflow_flux = dataset.select('BASEFLOW');
var bfVis = {
  min: -0.00000913,
  max:  0.00001076,
  palette: ['001137', '01abab', 'e7eb05', '620500']
};
Map.setCenter(-95, 39, 2);
Map.addLayer(baseflow_flux, bfVis, 'Baseflow flux');